Task 1: Key Concepts about Using the T-Test Statistic
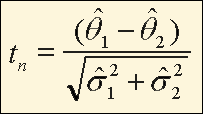
The t-test is used to test the null hypothesis that two population means or proportions, θ1 and θ2, are equal or, equivalently, that the difference between two population means or proportions is zero. To test this hypothesis, assuming the covariance is small, as is the case with NHANES data, the following formula is used:
Equation for t-Test Where Covariance is Small

where,
![]() 1 is an estimate of the first
population mean or proportion based on a probability sample,
1 is an estimate of the first
population mean or proportion based on a probability sample,
![]() 1 is an estimate of the standard
error of
1 is an estimate of the standard
error of
![]() 1,
1,
![]() 2 is an estimate of the second
population mean or proportion,
2 is an estimate of the second
population mean or proportion,
and
![]() 2 is an estimate of the
standard error of
2 is an estimate of the
standard error of
![]() 2.
2.
In instances where
only a small number (<30) of independent pieces of information are available
with which to estimate the quantity [![]() 1 -
1 -
![]() 2], the t-statistic given above
follows a Student's t distribution with zero mean and unit variance, and with a
number of degrees of freedom corresponding to the number of independent pieces
of information. In a simple random sample, the number of independent pieces of information is generally equal to the
number of people in the sample minus one. In NHANES, however, the number of
independent pieces of information is substantially lower due to the multi-stage
probability sample design. In NHANES, this number (referred to as degrees of
freedom) is equal to the number of PSUs minus the number of strata (see “Module
12: Sample Design” of the Continuous NHANES Tutorial for more information).
2], the t-statistic given above
follows a Student's t distribution with zero mean and unit variance, and with a
number of degrees of freedom corresponding to the number of independent pieces
of information. In a simple random sample, the number of independent pieces of information is generally equal to the
number of people in the sample minus one. In NHANES, however, the number of
independent pieces of information is substantially lower due to the multi-stage
probability sample design. In NHANES, this number (referred to as degrees of
freedom) is equal to the number of PSUs minus the number of strata (see “Module
12: Sample Design” of the Continuous NHANES Tutorial for more information).
The equality of means is usually tested at the 0.05 level of significance. However, at the 0.05 level of significance, some differences that are not meaningful (usually very small) are significant because of the large sample size.
![]() Close Window
to return to module page.
Close Window
to return to module page.