Brucellosis Surveillance
National Notifiable Diseases Surveillance System, 1993-2010
| Year | Number of Reported Cases in the U.S. |
|---|---|
| 1993 | 120 |
| 1994 | 119 |
| 1995 | 98 |
| 1996 | 112 |
| 1997 | 98 |
| 1998 | 79 |
| 1999 | 82 |
| 2000 | 87 |
| 2001 | 137 |
| 2002 | 125 |
| 2003 | 104 |
| 2004 | 115 |
| 2005 | 122 |
| 2006 | 124 |
| 2007 | 139 |
| 2008 | 80 |
| 2009 | 115 |
| 2010 | 115 |
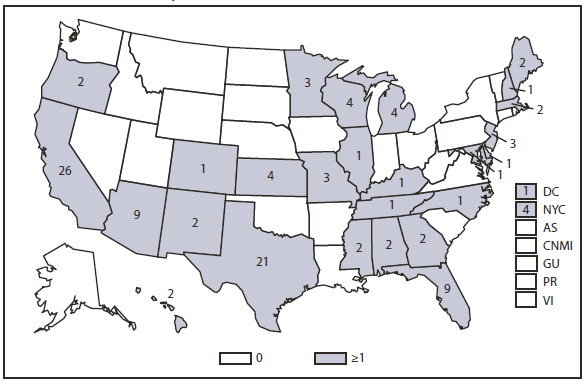
Number of Reported Cases—United States and U.S. Territories, 2010

The highest number (56.5%) of brucellosis cases was reported by California, Texas, Arizona, and Florida.
Number of Reported Cases – United States and U.S. Territories, 2010
| State | Number of Reported Cases |
|---|---|
| Alabama | 2 |
| Arizona | 9 |
| California | 26 |
| Colorado | 1 |
| Washington D.C. | 1 |
| Delaware | 1 |
| Florida | 9 |
| Georgia | 2 |
| Hawaii | 2 |
| Illinois | 1 |
| Kansas | 4 |
| Kentucky | 1 |
| Massachusetts | 2 |
| Maryland | 1 |
| Maine | 2 |
| Michigan | 4 |
| Minnesota | 3 |
| Missouri | 3 |
| Mississippi | 2 |
| North Carolina | 1 |
| New Hampshire | 1 |
| New Jersey | 3 |
| New Mexico | 2 |
| New York | 4 |
| Oregon | 2 |
| Tennessee | 1 |
| Texas | 21 |
| Wisconsin | 4 |
- Page last reviewed: November 12, 2012
- Page last updated: November 12, 2012
- Content source:


 ShareCompartir