

Surveillance for Viral Hepatitis – United States, 2013
 ShareCompartir
Entire report in a printable format [PDF – 1,441 KB – 65 pages] – Please note: An erratum has been published for the summary in this PDF. To view the erratum, please click here
Contents
Hepatitis A virus
Index
|
PAGE
|
DESCRIPTION
|
|---|---|
| Table 2.1 | Reported cases of hepatitis A, nationally and by state ― United States, 2009-2013 |
| Table 2.2 | Clinical characteristics of reported cases of hepatitis A ― United States, 2013 |
| Table 2.3 | Number and rate of hepatitis A-related deaths, by demographic characteristics and year — United States, 2009–2013 |
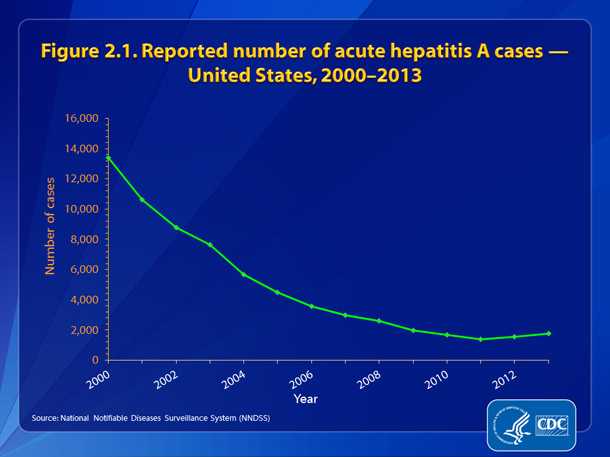
| Figure 2.1 | Reported number of acute hepatitis A cases — United States, 2000-2013 |
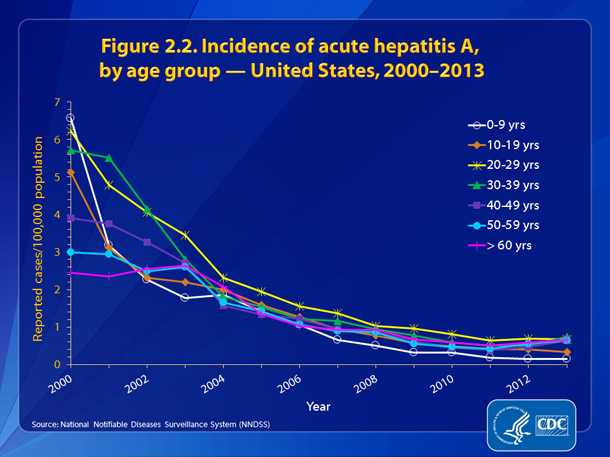
| Figure 2.2 | Incidence of hepatitis A, by age group — United States, 2000-2013 |
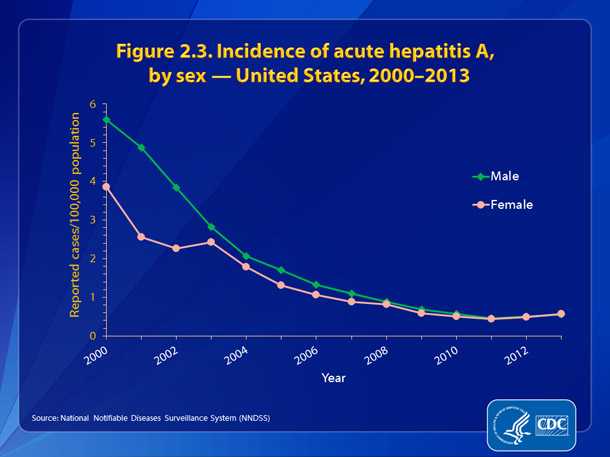
| Figure 2.3 | Incidence of hepatitis A, by sex — United States, 2000-2013 |
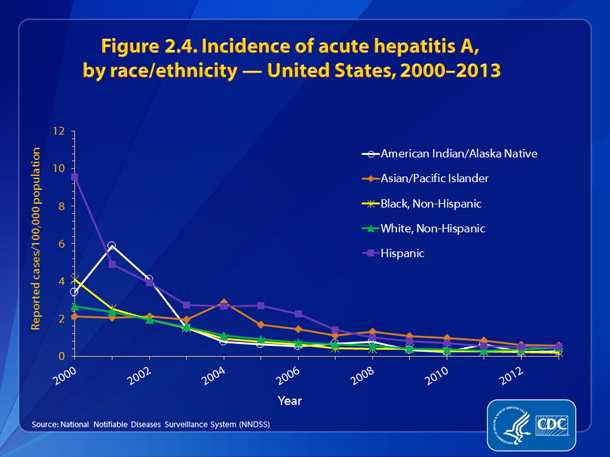
| Figure 2.4 | Incidence of hepatitis A, by race/ethnicity — United States, 2000-2013 |
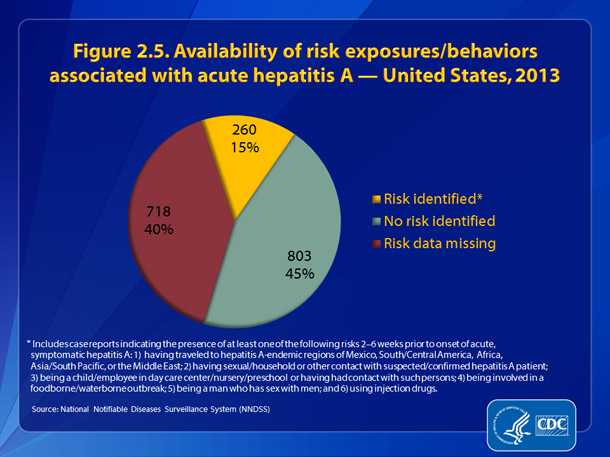
| Figure 2.5 | Availability of information on risk exposures/behaviors associated with hepatitis A – United States, 2013 |
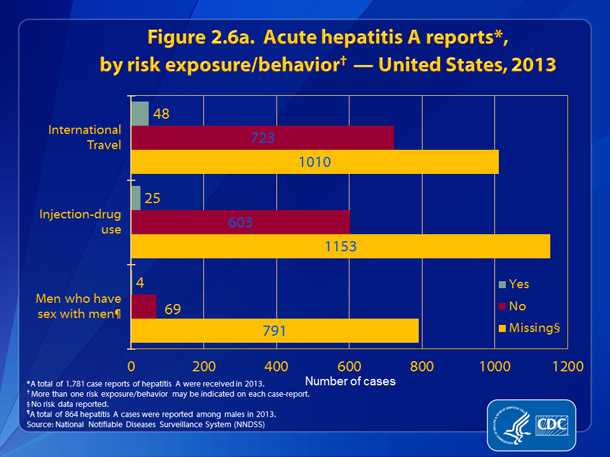
| Figure 2.6a | Hepatitis A reports, by risk behavior — United States, 2013 |
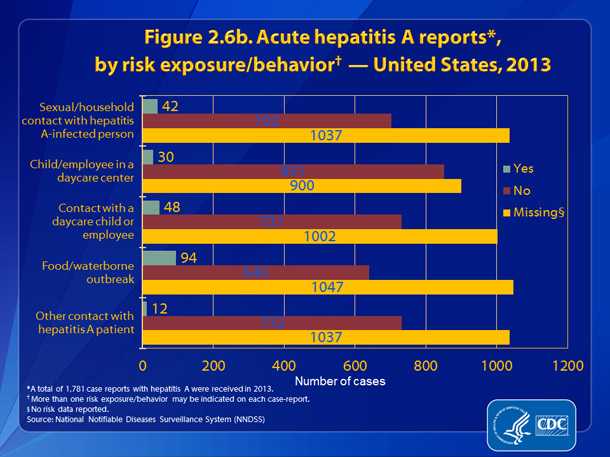
| Figure 2.6b | Hepatitis A reports, by risk exposure — United States, 2013 |
Hepatitis A virus
Table 2.1 Reported cases of acute hepatitis A, by state ― United States, 2009–2013
| State |
2009
|
2010
|
2011
|
2012
|
2013
|
|||||
|---|---|---|---|---|---|---|---|---|---|---|
| Rate* | (No.) | Rate | (No.) | Rate | (No.) | Rate | (No.) | Rate | (No.) | |
|
Alabama
|
0.3
|
(12)
|
0.2
|
(8)
|
0.2
|
(8)
|
0.4
|
(19)
|
0.2 | (10) |
|
Alaska
|
0.3
|
(2)
|
0.7
|
(5)
|
0.6
|
(4)
|
0.1
|
(1)
|
0.1 | (1) |
|
Arizona
|
1.0
|
(68)
|
1.0
|
(61)
|
1.2
|
(77)
|
1.4
|
(93)
|
1.0 | (66) |
|
Arkansas
|
0.4
|
(12)
|
0.1
|
(2)
|
0.1
|
(3)
|
0.3
|
(8)
|
0.3 | (9) |
|
California
|
0.7
|
(273)
|
0.6
|
(242)
|
0.5
|
(186)
|
0.5
|
(209)
|
0.7 | (255) |
|
Colorado
|
1.0
|
(52)
|
0.7
|
(36)
|
0.4
|
(21)
|
0.5
|
(28)
|
1.0 | (51) |
|
Connecticut
|
0.5
|
(18)
|
0.8
|
(29)
|
0.5
|
(18)
|
0.6
|
(23)
|
0.5 | (19) |
|
Delaware
|
0.5
|
(4)
|
0.8
|
(7)
|
0.2
|
(2)
|
1
|
(9)
|
0.4 | (4) |
|
District of Columbia
|
0.2
|
(1)
|
0.2
|
(1)
|
U
|
U
|
U
|
U
|
U | (U) |
|
Florida
|
0.9
|
(171)
|
0.7
|
(139)
|
0.5
|
(87)
|
0.5
|
(87)
|
0.6 | (115) |
|
Georgia
|
0.5
|
(54)
|
0.4
|
(40)
|
0.3
|
(27)
|
0.5
|
(46)
|
0.4 | (36) |
|
Hawaii
|
0.8
|
(11)
|
0.6
|
(8)
|
0.6
|
(8)
|
0.4
|
(5)
|
1.1 | (16) |
|
Idaho
|
0.3
|
(5)
|
0.5
|
(8)
|
0.4
|
(6)
|
0.7
|
(11)
|
0.5 | (8) |
|
Illinois
|
1.0
|
(126)
|
0.4
|
(48)
|
0.6
|
(73)
|
0.5
|
(67)
|
0.6 | (79) |
|
Indiana
|
0.3
|
(17)
|
0.2
|
(12)
|
0.4
|
(24)
|
0.2
|
(11)
|
0.5 | (32) |
|
Iowa
|
1.3
|
(38)
|
0.4
|
(11)
|
0.3
|
(8)
|
0.2
|
(7)
|
0.6 | (17) |
|
Kansas
|
0.4
|
(12)
|
0.5
|
(14)
|
0.1
|
(4)
|
0.5
|
(15)
|
0.4 | (11) |
|
Kentucky
|
0.3
|
(12)
|
0.6
|
(26)
|
0.2
|
(10)
|
0.6
|
(25)
|
0.5 | (24) |
|
Louisiana
|
0.1
|
(6)
|
0.2
|
(11)
|
0.1
|
(5)
|
0.2
|
(7)
|
0.3 | (14) |
|
Maine
|
0.1
|
(1)
|
0.5
|
(7)
|
0.5
|
(6)
|
0.7
|
(9)
|
0.8 | (10) |
|
Maryland
|
0.8
|
(47)
|
0.4
|
(23)
|
0.4
|
(26)
|
0.5
|
(28)
|
0.5 | (29) |
|
Massachusetts
|
1.1
|
(71)
|
0.7
|
(48)
|
0.6
|
(39)
|
0.6
|
(40)
|
0.6 | (43) |
|
Michigan
|
0.7
|
(72)
|
0.7
|
(73)
|
0.7
|
(70)
|
1
|
(100)
|
0.8 | (83) |
|
Minnesota
|
0.6
|
(29)
|
0.7
|
(37)
|
0.5
|
(27)
|
0.5
|
(29)
|
0.6 | (32) |
|
Mississippi
|
0.3
|
(9)
|
0.1
|
(2)
|
0.2
|
(7)
|
0.4
|
(11)
|
0.2 | (5) |
|
Missouri
|
0.4
|
(21)
|
0.4
|
(21)
|
0.2
|
(13)
|
0.3
|
(20)
|
0.1 | (8) |
|
Montana
|
0.6
|
(6)
|
0.4
|
(4)
|
0.3
|
(3)
|
0.6
|
(6)
|
0.6 | (6) |
|
Nebraska
|
1.2
|
(21)
|
0.8
|
(14)
|
0.3
|
(5)
|
0.9
|
(16)
|
0.7 | (13) |
|
Nevada
|
0.6
|
(15)
|
0.5
|
(14)
|
0.2
|
(5)
|
0.4
|
(10)
|
0.7 | (19) |
|
New Hampshire
|
0.5
|
(7)
|
0.2
|
(2)
|
0
|
(0)
|
0.5
|
(6)
|
0.7 | (9) |
|
New Jersey
|
0.8
|
(71)
|
0.9
|
(76)
|
0.9
|
(79)
|
0.7
|
(60)
|
0.8 | (68) |
|
New Mexico
|
0.4
|
(8)
|
0.2
|
(5)
|
0.3
|
(7)
|
0.5
|
(10)
|
1.0 | (20) |
|
New York
|
0.7
|
(136)
|
0.8
|
(147)
|
0.6
|
(113)
|
0.6
|
(111)
|
0.8 | (167) |
|
North Carolina
|
0.4
|
(41)
|
0.5
|
(48)
|
0.3
|
(31)
|
0.3
|
(34)
|
0.5 | (46) |
|
North Dakota
|
0.3
|
(2)
|
0.6
|
(4)
|
0
|
(0)
|
0.3
|
(2)
|
1.2 | (9) |
|
Ohio
|
0.3
|
(36)
|
0.4
|
(47)
|
0.3
|
(39)
|
0.3
|
(36)
|
0.5 | (59) |
|
Oklahoma
|
0.2
|
(7)
|
0.2
|
(6)
|
0.3
|
(11)
|
0.3
|
(12)
|
0.4 | (14) |
|
Oregon
|
0.5
|
(19)
|
0.4
|
(17)
|
0.3
|
(11)
|
0.2
|
(9)
|
0.7 | (29) |
|
Pennsylvania
|
0.5
|
(68)
|
0.4
|
(53)
|
0.5
|
(60)
|
0.5
|
(62)
|
0.4 | (53) |
|
Rhode Island
|
0.9
|
(9)
|
0.9
|
(9)
|
0.8
|
(8)
|
0.3
|
(3)
|
0.4 | (4) |
|
South Carolina
|
1.4
|
(63)
|
0.6
|
(26)
|
0.2
|
(11)
|
0.1
|
(6)
|
0.3 | (14) |
|
South Dakota
|
0.4
|
(3)
|
0.1
|
(1)
|
0.2
|
(2)
|
0
|
0
|
0.5 | (4) |
|
Tennessee
|
0.2
|
(13)
|
0.2
|
(12)
|
0.4
|
(23)
|
0.4
|
(23)
|
0.3 | (20) |
|
Texas
|
0.7
|
(184)
|
0.6
|
(139)
|
0.5
|
(138)
|
0.5
|
(134)
|
0.4 | (109) |
|
Utah
|
0.3
|
(7)
|
0.4
|
(12)
|
0.3
|
(8)
|
0.1
|
(4)
|
0.4 | (12) |
|
Vermont
|
0.3
|
(2)
|
0
|
0
|
1.0
|
(6)
|
0.3
|
(2)
|
1.1 | (7) |
|
Virginia
|
0.5
|
(42)
|
0.6
|
(52)
|
0.4
|
(30)
|
0.6
|
(49)
|
0.4 | (36) |
|
Washington
|
0.6
|
(42)
|
0.3
|
(21)
|
0.5
|
(31)
|
0.4
|
(29)
|
0.6 | (45) |
|
West Virginia
|
0.3
|
(6)
|
0.8
|
(15)
|
0.4
|
(8)
|
0.4
|
(8)
|
0.2 | (4) |
|
Wisconsin
|
0.6
|
(33)
|
0.4
|
(23)
|
0.1
|
(8)
|
0.4
|
(21)
|
0.6 | (37) |
|
Wyoming
|
0.4
|
(2)
|
0.7
|
(4)
|
0.4
|
(2)
|
0.2
|
(1)
|
0.0 | (0) |
|
Total
|
0.6
|
(1,987)
|
0.5
|
(1,670)
|
0.4
|
(1,398)
|
0.5
|
(1,562)
|
0.6 | (1,781) |
*Rate per 100,000 population.
U=No data available for reporting.
Source: CDC, National Notifiable Diseases Surveillance System.
Table 2.2 Clinical characteristics of reported cases of hepatitis A ― United States, 2013
| Clinical characteristic |
Availability of valid data† for clinical characteristic
|
Cases with clinical characteristic§
|
||
|---|---|---|---|---|
|
No.
|
%
|
No.
|
%
|
|
|
Jaundice
|
1,095 | 61.5 | 753 | 68.8 |
|
Hospitalized for hepatitis A
|
1,081 | 60.7 | 519 | 48.0 |
|
Died from hepatitis A
|
959 | 53.8 | 9 | 0.9 |
*A total of 1,562 hepatitis A cases were reported during 2012.
†Case reports for which questions regarding clinical characteristics were answered with “yes” or “no.” Reports with any other response were excluded.
§Numbers and percentages represent only those case reports for which data regarding clinical characteristics were available; numbers likely are underestimates.
Source: CDC, National Notifiable Diseases Surveillance System.
Table 2.3 Number and rate of hepatitis A-related deaths, by demographic characteristics and year — United States, 2009–2013
| Demographic characterisic |
2009
|
2010
|
2011
|
2012
|
2013
|
||||||
|---|---|---|---|---|---|---|---|---|---|---|---|
| No. | Rate | No. | Rate | No. | Rate | No. | Rate | No. | Rate | ||
| Age Group (years) |
0–34 | 1 | 0.00 | 3 | 0.00 | 0 | 0.00 | 2 | 0.00 | 2 | 0.00 |
| 35–44 | 1 | 0.00 | 7 | 0.02 | 1 | 0.00 | 5 | 0.01 | 2 | 0.00 | |
| 45–54 | 14 | 0.03 | 25 | 0.06 | 11 | 0.02 | 12 | 0.03 | 13 | 0.03 | |
| 55–64 | 22 | 0.06 | 34 | 0.09 | 16 | 0.04 | 23 | 0.06 | 30 | 0.08 | |
| 65–74 | 12 | 0.06 | 10 | 0.05 | 12 | 0.05 | 17 | 0.07 | 19 | 0.08 | |
| ≥75 | 32 | 0.17 | 16 | 0.09 | 29 | 0.15 | 18 | 0.09 | 14 | 0.07 | |
| Race | White§ | 68 | 0.02 | ||||||||
| Black¶ | 13 | 0.04 | |||||||||
| Non-White, non-Black | 1 | 0.00 | |||||||||
| Race/ Ethnicity |
White, non- Hispanic |
65 | 0.03 | 44 | 0.02 | 51 | 0.02 | 63 | 0.02 | ||
| Black, non- Hispanic |
15 | 0.04 | 10 | 0.03 | 8 | 0.02 | 6 | 0.01 | |||
| Hispanic | 12 | 0.03 | 6 | 0.02 | 8 | 0.02 | 8 | 0.02 | |||
| Asian/Pacific Islander |
2 | 0.02 | 8 | 0.06 | 7 | 0.05 | 3 | 0.02 | |||
| American Indian/Alaskan Native |
1 | 0.05 | 1 | 0.04 | 2 | 0.08 | 0 | 0.00 | |||
| Sex | Male | 50 | 0.03 | 73 | 0.05 | 37 | 0.02 | 46 | 0.03 | 50 | 0.03 |
| Female | 32 | 0.02 | 22 | 0.01 | 32 | 0.02 | 31 | 0.02 | 30 | 0.01 | |
| Overall | 82 | 0.02 | 95 | 0.03 | 69 | 0.02 | 77 | 0.02 | 80 | 0.02 | |
* Rates for race, sex, and overall total are age-adjusted per 100,000 U.S. standard population.
†Cause of death is defined as the underlying cause of death or one of the multiple causes of death and is based on the International Classification of Diseases, 10th Revision (ICD-10) codes B15 (hepatitis A).
§ The race category "White" Included white, non-Hispanic and white Hispanic. The race category "Black" included black, non-Hispanic and black Hispanic. The race category "Non-White, non-Black" included all other races.
¶ The race/ethnicity category was added starting in 2010 to incorporate bridged race categories. One death in 2012 is not represented under the race/ethnicity category due to missing race and/or ethnicity data.
Source: CDC. National Vital Statistics System.
All seven figure slides in PowerPoint 2007 format [PPTX – 820KB]
Hepatitis B virus
|
PAGE
|
DESCRIPTION
|
|---|---|
| Table 3.1 | Reported cases of acute hepatitis B, nationally and by state ― United States, 2009-2013 |
| Table 3.2 | Clinical characteristics of reported cases of acute hepatitis B ― United States, 2013 |
| Table 3.3 | Number of newly reported chronic hepatitis B case-reports submitted by states, 2013 |
| Table 3.4 | Reported cases of chronic hepatitis B, by demographic characteristics and laboratory tests – Enhanced Viral Hepatitis Surveillance Sites, 2013 |
| Table 3.5 | Number and rate of hepatitis B-related deaths, by demographic characteristics and year – United States, 2009-2013 |
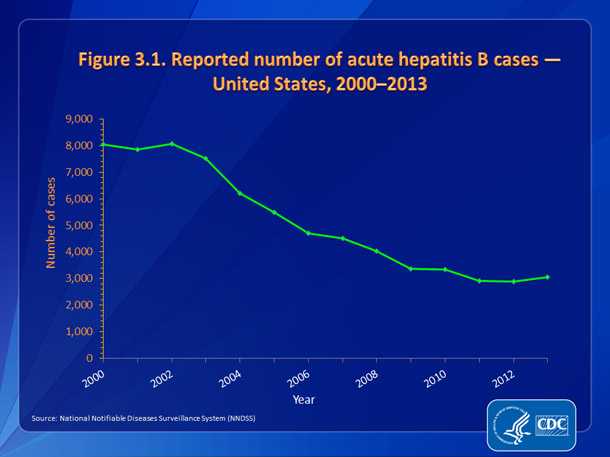
| Figure 3.1 | Reported number of acute hepatitis B cases — United States, 2000-2013 |
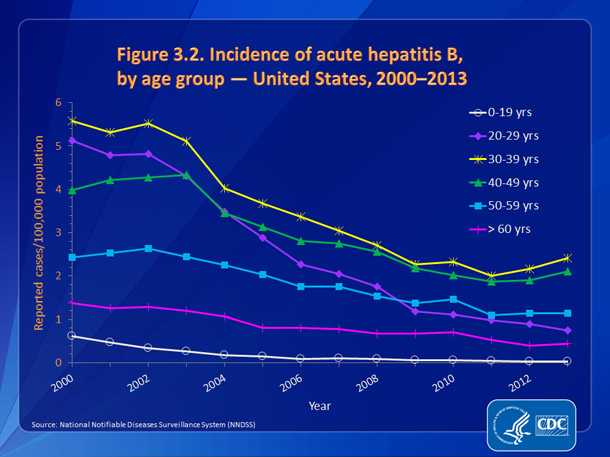
| Figure 3.2 | Incidence of acute hepatitis B, by age group — United States, 2000-2013 |
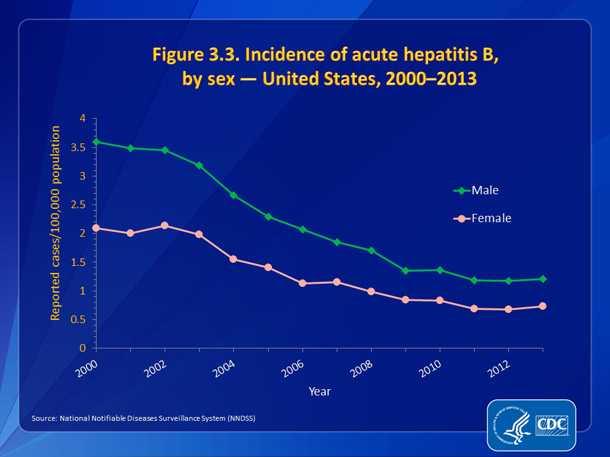
| Figure 3.3 | Incidence of acute hepatitis B, by sex — United States, 2000-2013 |
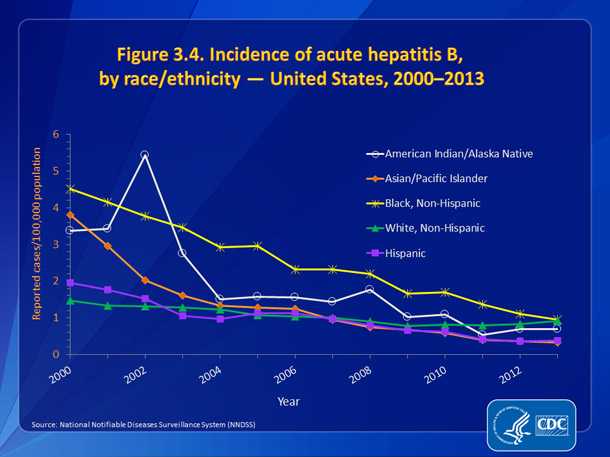
| Figure 3.4 | Incidence of acute hepatitis B, by race/ethnicity — United States, 2000-2013 |
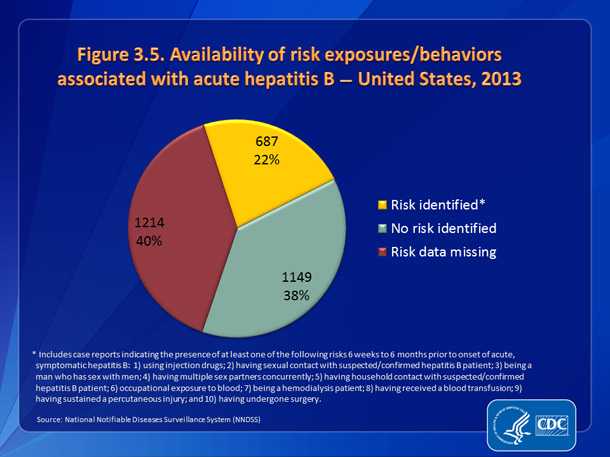
| Figure 3.5 | Availability of information on risk behaviors/exposures associated with acute hepatitis B — United States, 2013 |
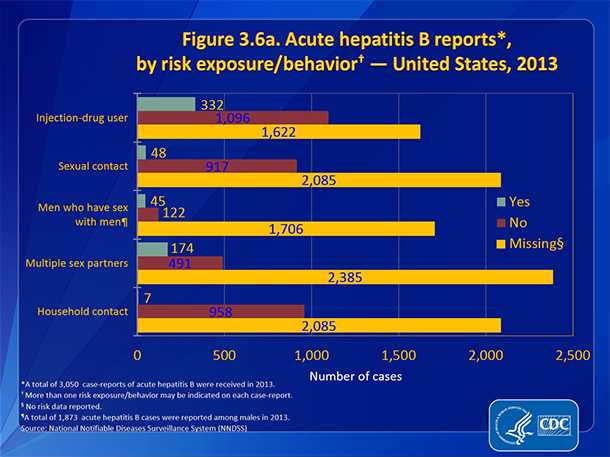
| Figure 3.6a | Acute hepatitis B reports, by risk behavior — United States, 2013 |
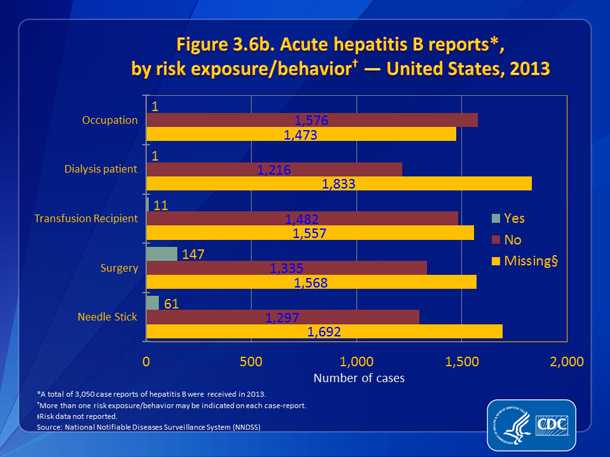
| Figure 3.6b | Acute hepatitis B reports, by risk exposure — United States, 2013 |
Hepatitis B virus
Table 3.1 Reported cases of acute hepatitis B, nationally and by state ― United States, 2009-2013
| State |
2009
|
2010
|
2011
|
2012
|
2013
|
|||||
|---|---|---|---|---|---|---|---|---|---|---|
| Rate* | (No.) | Rate | (No.) | Rate | (No.) | Rate | (No.) | Rate | (No.) | |
|
Alabama
|
1.9
|
(89)
|
1.4
|
(68)
|
2.5
|
(119)
|
1.6
|
(79)
|
1.9
|
(90) |
|
Alaska
|
0.6
|
(4)
|
0.7
|
(5)
|
0.4
|
(3)
|
0.1
|
(1)
|
0.1
|
(1) |
|
Arizona
|
0.6
|
(42)
|
0.4
|
(26)
|
0.2
|
(14)
|
0.2
|
(14)
|
0.4
|
(28) |
|
Arkansas
|
2.2
|
(65)
|
2.3
|
(66)
|
1.9
|
(57)
|
2.5
|
(74)
|
1.7
|
(50) |
|
California
|
0.7
|
(258)
|
0.7
|
(252)
|
0.4
|
(157)
|
0.4
|
(136)
|
0.4
|
(138) |
|
Colorado
|
0.5
|
(27)
|
0.9
|
(46)
|
0.4
|
(23)
|
0.5
|
(24)
|
0.5
|
(24) |
|
Connecticut
|
0.5
|
(16)
|
0.6
|
(22)
|
0.5
|
(19)
|
0.4
|
(15)
|
0.2
|
(8) |
|
Delaware †
|
U
|
U
|
U
|
U
|
1.4
|
(13)
|
1.2
|
(11)
|
1.5
|
(14) |
|
District of Columbia
|
1.7
|
(10)
|
0.5
|
(3)
|
U
|
U
|
U
|
U
|
U
|
(U) |
|
Florida
|
1.6
|
(299)
|
1.6
|
(297)
|
1.1
|
(213)
|
1.3
|
(247)
|
1.7
|
(323) |
|
Georgia
|
1.5
|
(144)
|
1.7
|
(165)
|
1.4
|
(142)
|
1.1
|
(109)
|
1.0
|
(104) |
|
Hawaii
|
0.5
|
(6)
|
0.4
|
(6)
|
0.4
|
(6)
|
0.4
|
(5)
|
0.3
|
(4) |
|
Idaho
|
0.7
|
(11)
|
0.4
|
(6)
|
0.1
|
(2)
|
0.3
|
(5)
|
0.8
|
(13) |
|
Illinois
|
0.9
|
(118)
|
1.1
|
(135)
|
0.7
|
(85)
|
0.7
|
(86)
|
0.7
|
(94) |
|
Indiana
|
1.2
|
(74)
|
1.2
|
(75)
|
1.1
|
(70)
|
1.4
|
(90)
|
1.5
|
(101) |
|
Iowa
|
1.2
|
(37)
|
0.5
|
(15)
|
0.5
|
(15)
|
0.4
|
(13)
|
0.4
|
(11) |
|
Kansas
|
0.2
|
(6)
|
0.4
|
(11)
|
0.5
|
(15)
|
0.3
|
(9)
|
0.4
|
(11) |
|
Kentucky
|
2.1
|
(90)
|
3.1
|
(136)
|
3.5
|
(151)
|
4.1
|
(180)
|
4.9
|
(214) |
|
Louisiana
|
1.6
|
(73)
|
1.2
|
(55)
|
1.4
|
(62)
|
1
|
(44)
|
1.8
|
(82) |
|
Maine
|
1.1
|
(15)
|
1.0
|
(13)
|
0.6
|
(8)
|
0.7
|
(9)
|
0.8
|
(11) |
|
Maryland
|
1.3
|
(72)
|
1.2
|
(67)
|
1.1
|
(62)
|
0.9
|
(52)
|
0.7
|
(43) |
|
Massachusetts
|
0.3
|
(17)
|
0.2
|
(13)
|
1.0
|
(67)
|
1.1
|
(75)
|
1.1
|
(71) |
|
Michigan
|
1.3
|
(132)
|
1.2
|
(122)
|
0.9
|
(91)
|
0.8
|
(81)
|
0.5
|
(53) |
|
Minnesota
|
0.7
|
(38)
|
0.4
|
(23)
|
0.4
|
(20)
|
0.3
|
(17)
|
0.4
|
(19) |
|
Mississippi
|
1.1
|
(33)
|
1.1
|
(33)
|
1.9
|
(57)
|
2.6
|
(78)
|
1.8
|
(55) |
|
Missouri
|
0.8
|
(47)
|
1.1
|
(67)
|
1.0
|
(60)
|
0.8
|
(48)
|
1.0
|
(61) |
|
Montana
|
0.1
|
(1)
|
0
|
(0)
|
0
|
(0)
|
0.2
|
(2)
|
0.4
|
(4) |
|
Nebraska
|
1.2
|
(22)
|
0.7
|
(12)
|
0.7
|
(12)
|
0.5
|
(10)
|
0.5
|
(9) |
|
Nevada
|
1.3
|
(34)
|
1.5
|
(41)
|
1.1
|
(29)
|
1
|
(28)
|
1.0
|
(29) |
|
New Hampshire
|
0.5
|
(6)
|
0.4
|
(5)
|
0.2
|
(3)
|
0.3
|
(4)
|
0.2
|
(2) |
|
New Jersey
|
1.1
|
(93)
|
0.9
|
(77)
|
0.8
|
(73)
|
0.8
|
(70)
|
0.7
|
(65) |
|
New Mexico
|
0.4
|
(8)
|
0.2
|
(5)
|
0.5
|
(10)
|
0.1
|
(3)
|
0.1
|
(3) |
|
New York
|
0.7
|
(129)
|
0.7
|
(139)
|
0.7
|
(134)
|
0.6
|
(113)
|
0.6
|
(117) |
|
North Carolina
|
1.1
|
(104)
|
1.2
|
(113)
|
1.1
|
(109)
|
0.7
|
(73)
|
0.8
|
(75) |
|
North Dakota
|
0
|
(0)
|
0
|
(0)
|
0
|
(0)
|
0
|
0
|
0.0
|
(0) |
|
Ohio
|
0.8
|
(88)
|
0.8
|
(95)
|
0.8
|
(90)
|
1.5
|
(178)
|
1.9
|
(225) |
|
Oklahoma
|
3.3
|
(122)
|
3.1
|
(115)
|
2.6
|
(100)
|
2.1
|
(79)
|
1.0
|
(40) |
|
Oregon
|
1.2
|
(44)
|
1.1
|
(42)
|
0.8
|
(32)
|
0.6
|
(25)
|
0.8
|
(32) |
|
Pennsylvania
|
0.8
|
(106)
|
0.6
|
(72)
|
0.7
|
(84)
|
0.5
|
(63)
|
0.3
|
(43) |
|
Rhode Island
|
U
|
U
|
U
|
U
|
U
|
U
|
U
|
U
|
U
|
(U) |
|
South Carolina
|
1.2
|
(56)
|
1.3
|
(59)
|
0.8
|
(39)
|
0.8
|
(37)
|
1.2
|
(58) |
|
South Dakota
|
0.5
|
(4)
|
0.2
|
(2)
|
0.2
|
(2)
|
0.2
|
(2)
|
0.6
|
(5) |
|
Tennessee
|
2.2
|
(136)
|
2.4
|
(150)
|
3.0
|
(192)
|
3.7
|
(240)
|
4.0
|
(262) |
|
Texas
|
1.7
|
(420)
|
1.6
|
(394)
|
0.8
|
(204)
|
0.7
|
(170)
|
0.5
|
(142) |
|
Utah
|
0.2
|
(5)
|
0.3
|
(8)
|
0.4
|
(10)
|
0.5
|
(13)
|
0.2
|
(5) |
|
Vermont
|
0
|
(0)
|
0.3
|
(2)
|
0
|
(0)
|
0.3
|
(2)
|
0.3
|
(2) |
|
Virginia
|
1.4
|
(110)
|
1.2
|
(97)
|
1.0
|
(84)
|
1
|
(84)
|
0.9
|
(72) |
|
Washington
|
0.7
|
(48)
|
0.7
|
(50)
|
0.5
|
(35)
|
0.5
|
(34)
|
0.5
|
(33) |
|
West Virginia
|
4.6
|
(84)
|
4.7
|
(88)
|
6.1
|
(113)
|
7.6
|
(141)
|
10.5
|
(195) |
|
Wisconsin
|
0.4
|
(24)
|
0.9
|
(54)
|
0.3
|
(17)
|
0.4
|
(22)
|
0.2
|
(9) |
|
Wyoming
|
0.7
|
(4)
|
0.5
|
(3)
|
0
|
(0)
|
0
|
0
|
U
|
(U) |
|
Total
|
1.1
|
(3,371)
|
1.1
|
(3,350)
|
0.9
|
(2,890)
|
0.9
|
(2,895)
|
1.0
|
(3,050) |
*Rate per 100,000 population.
† Updated data for Delaware in 2011.
U=No data available for reporting.
Source: CDC, National Notifiable Diseases Surveillance System.
Table 3.2 Clinical characteristics of reported cases of acute hepatitis B ― United States, 2013
| Clinical characteristic |
Availability of valid data† for clinical characteristic
|
Cases with clinical characteristic§
|
||
|---|---|---|---|---|
|
No.
|
%
|
No.
|
%
|
|
|
Jaundice
|
2,149 | 70.5 | 1,653 | 76.9 |
|
Hospitalized for hepatitis B
|
2,125 | 69.7 | 1,250 | 58.8 |
|
Died from hepatitis B
|
2,018 | 66.2 | 18 | 0.9 |
* A total of 3,050 hepatitis B cases were reported during 2013.
† Case reports for which questions regarding clinical characteristics were answered with “yes” or “no.” Reports with any other response were excluded.
§ Numbers and percentages represent only those case reports for which data regarding clinical characteristics were available; numbers likely are underestimates.
Source: CDC, National Notifiable Diseases Surveillance System.
Table 3.3 Number of newly reported chronic hepatitis B case-reports submitted by states, 2013
| Jurisdiction^ | No. chronic hepatitis B case reports submitted |
|
|
|---|---|---|---|
| Colorado¶ | 511 | NNDSS | |
| Delaware | 126 | State-provided | |
| Florida¶ | 4,270 | NNDSS | |
| Iowa | 266 | State-provided | |
| Kansas | 108 | State-provided | |
| Maine¶ | 107 | State-provided | |
| Michigan¶ | 1,130 | State-provided | |
| Minnesota¶ | 189 | NNDSS | |
| Montana¶ | 21 | State-provided | |
| New Jersey** | 303 | NNDSS | |
| New Mexico¶ | 119 | NNDSS | |
| New York (minus New York City)** |
636 | State-provided | |
| New York City** | 5,857 | State-provided | |
| Oregon** | 150 | State-provided | |
| Pennsylvania¶ | 1,512 | State-provided | |
| South Carolina†† | 448 | NNDSS | |
| South Dakota¶ | 79 | NNDSS | |
| West Virginia¶ | 212 | State-provided | |
| Total | 16,044 |
Abbreviation: NNDSS, National Notifiable Diseases Surveillance System
* For case-definition, see
http://wwwn.cdc.gov/nndss/script/ConditionList.aspx?Type=0&Yr=2012
† Reports may not reflect unique cases.
§ Jurisdictions that gave permission to report their number of chronic HBV cases
** Includes confirmed case reports only.
†† Includes confirmed, probable, and suspect case reports.
Table 3.4. Reported cases of chronic hepatitis B, by demographic characteristics and laboratory tests – Enhanced Viral Hepatitis Surveillance Sites, 2013
| Category | Massa- chusetts No. (%) |
Michigan No. (%) |
New York State† No. (%) |
Philadel- phia No. (%) |
San Francisco No. (%) |
Washing- ton§ No. (%) |
Total No. (%) |
|---|---|---|---|---|---|---|---|
| Sex | |||||||
| Female | 224 49.1% |
207 43.9% |
236 36.5% |
118 42.1% |
339 46.3% |
72 42.4% |
1,196 43.4% |
| Male | 231 50.7% |
264 56.1% |
409 63.2% |
162 57.9% |
387 52.9% |
91 53.5% |
1,544 56.0% |
| Unknown/ missing |
1 0.2% |
0 0.0% |
2 0.3% |
0 0.0% |
6 0.8% |
7 4.1% |
16 0.6% |
| Race/ethnicity | |||||||
| American Indian/ Alaskan Native, non-Hispanic (NH) |
0 0.0% |
5 1.1% |
1 0.2% |
0 0.0% |
0 0.0% |
4 2.4% |
10 0.4% |
| Asian/Pacific Islander, NH |
177 38.8% |
114 24.2% |
176 27.2% |
98 35.0% |
364 49.7% |
48 28.2% |
977 35.4% |
| Black, NH | 80 17.5% |
98 20.8% |
83 12.8% |
52 18.6% |
9 1.2% |
5 2.9% |
327 11.9% |
| White, NH | 46 10.1% |
124 26.3% |
99 15.3% |
14 5.0% |
16 2.2% |
30 17.6% |
329 11.9% |
| Hispanic | 30 6.6% |
7 1.5% |
29 4.5% |
12 4.3% |
0 0.0% |
5 2.9% |
83 3.0% |
| Other, NH | 29 6.4% |
26 5.5% |
26 4.0% |
9 3.2% |
6 0.8% |
5 2.9% |
101 3.7% |
| Unknown/ missing |
94 20.6% |
97 20.6% |
233 36.0% |
95 33.9% |
337 46.0% |
73 42.9% |
929 33.7% |
| Age group, years | |||||||
| 0-14 | 7 1.5% |
9 1.9% |
5 0.8% |
3 1.1% |
6 0.8% |
4 2.4% |
34 1.2% |
| 15-24 | 34 7.5% |
31 6.6% |
60 9.3% |
22 7.9% |
49 6.7% |
15 8.8% |
211 7.7% |
| 25-39 | 165 36.2% |
143 30.4% |
240 37.1% |
93 33.2% |
258 35.2% |
48 28.2% |
947 34.4% |
| 40-54 | 141 30.9% |
147 31.2% |
189 29.2% |
101 36.1% |
215 29.4% |
62 36.5% |
855 31.0% |
| 55+ | 109 23.9% |
141 29.9% |
153 23.6% |
61 21.8% |
204 27.9% |
41 24.1% |
709 25.7% |
| Unknown/ missing |
0 0.0% |
0 0.0% |
0 0.0% |
0 0.0% |
0 0.0% |
0 0.0% |
0 0.0% |
| Place of birth | |||||||
| United States | 39 8.6% |
127 27.0% |
12 1.9% |
139 49.6% |
10 1.4% |
U |
327 12.6% |
| Outside United States | 224 49.1% |
121 25.7% |
47 7.3% |
120 42.9% |
67 9.2% |
U |
579 22.4% |
| Unknown/ missing |
193 42.3% |
223 47.3% |
588 90.9% |
21 7.5% |
655 89.5% |
U |
1,680 65.0% |
| Hepatitis B laboratory testing¶ | |||||||
| HBV surface antigen + | 399 87.5% |
269 57.1% |
541 83.6% |
233 83.2% |
654 89.3% |
81 47.6% |
2,177 79.0% |
| [IgM anti-HBc] – | 77 16.9% |
25 5.3% |
106 16.4% |
0 0.0% |
0 0.0% |
42 24.7% |
250 9.1% |
| HBV “e” antigen + | 155 34.0% |
2 0.4% |
99 15.3% |
64 22.9% |
75 10.2% |
12 7.1% |
407 14.8% |
| HBV NAT + | 281 61.6% |
4 0.8% |
203 31.4% |
228 81.4% |
465 63.5% |
45 26.5% |
1,226 44.5% |
| Total no. cases | 456 | 471 | 647 | 280 | 732 | 170 | 2,756 |
| 2013 Estimated population total** |
6,692,824 | 9,895,622 | 11,245,290 | 1,553,165 | 837,442 | 5,405,750 | 35,630,093 |
| Rate per 100,000 population |
6.8 | 4.8 | 5.8 | 18.0 | 87.4 | 3.1 | 7.7 |
* Chronic hepatitis B data from Florida, one of the 7 funded sites, were not included in this table. Chronic hepatitis B data from all funded sites, including Florida, will be published in an updated table in July.
† Cases and population estimates from New York excluded those who resided in New York City.
§ Cases from Washington excluded Snohomish County, Pierce County, and 90% of King County.
¶ Cases can be reported with more than one laboratory test result. The denominator used to calculate proportions was the total number of cases reported for each site.
** Population estimates for the United States: https://wonder.cdc.gov/bridged-race-population.html. Population estimates from Washington excluded Snohomish and Pierce Counties.
U = No data available for reporting.
Table 3.5. Number and rate of hepatitis B-related deaths, by demographic characteristics and year – United States, 2009-2013
| Demographic characteristic |
2009
|
2010
|
2011
|
2012
|
2013
|
||||||
|---|---|---|---|---|---|---|---|---|---|---|---|
| No. | Rate | No. | Rate | No. | Rate | No. | Rate | No. | Rate | ||
| Age Group (years) |
0–34 | 39 | 0.03 | 48 | 0.03 | 41 | 0.03 | 38 | 0.03 | 40 | 0.03 |
| 35–44 | 143 | 0.34 | 142 | 0.35 | 143 | 0.35 | 123 | 0.30 | 146 | 0.36 | |
| 45–54 | 469 | 1.05 | 448 | 1.00 | 421 | 0.94 | 428 | 0.97 | 389 | 0.89 | |
| 55–64 | 547 | 1.57 | 610 | 1.67 | 645 | 1.69 | 639 | 1.66 | 704 | 1.79 | |
| 65–74 | 254 | 1.22 | 296 | 1.36 | 285 | 1.27 | 314 | 1.31 | 343 | 1.36 | |
| ≥75 | 245 | 1.30 | 248 | 1.34 | 269 | 1.42 | 229 | 1.20 | 251 | 1.29 | |
| Race§ | White | 978 | 0.35 | ||||||||
| Black | 320 | 0.87 | |||||||||
| Non-White, non-Black | 399 | 2.15 | |||||||||
| Race/ Ethnicity ¶** |
White, non- Hispanic |
856 | 0.34 | 832 | 0.32 | 818 | 0.31 | 868 | 0.33 | ||
| Black, non- Hispanic |
356 | 0.94 | 373 | 0.98 | 322 | 0.81 | 384 | 0.98 | |||
| Hispanic | 136 | 0.43 | 161 | 0.48 | 139 | 0.39 | 149 | 0.39 | |||
| Asian/Pacific Islander |
421 | 2.95 | 422 | 2.72 | 469 | 2.93 | 451 | 2.64 | |||
| American Indian/Alaskan Native |
17 | 0.73 | 9 | 0.38 | 18 | 0.74 | 14 | 0.55 | |||
| Sex | Male | 1,267 | 0.80 | 1,316 | 0.81 | 1,321 | 0.80 | 1,272 | 0.75 | 1,375 | 0.79 |
| Female | 430 | 0.24 | 476 | 0.27 | 483 | 0.26 | 499 | 0.27 | 498 | 0.26 | |
|
Overall
|
1,697 | 0.51 | 1,792 | 0.52 | 1,804 | 0.52 | 1,771 | 0.50 | 1,873 | 0.52 | |
* Rates for race, sex, and overall total are age-adjusted per 100,000 U.S. standard population in 2000.
† Cause of death is defined as the underlying cause of death or one of the multiple causes of death and is based on the International Classification of Diseases, 10th Revision (ICD-10) codes B16, B17.0, B18.0, B18.1 (hepatitis B).
§ The race category "White" Included white, non-Hispanic and white Hispanic. The race category "Black" included black, non-Hispanic and black Hispanic. The race category "Non-White, non-Black" included all other races.
¶ The race/ethnicity category was added starting in 2010 to incorporate bridged race categories. Six deaths in 2010, seven deaths in 2011, five deaths in 2012, and seven deaths in 2013 are not represented under the race/ethnicity category due to missing race and/or ethnicity data.
Source: CDC. National Vital Statistics System.
Downloads of this slide: PDF PowerPoint
All seven figure slides in PowerPoint 2007 format [PPTX – 369 KB]
Hepatitis C virus
|
PAGE
|
DESCRIPTION
|
|---|---|
| Table 4.1 | Reported cases of acute hepatitis C, nationally and by state ― United States, 2009-2013 |
| Table 4.2 | Clinical characteristics of reported cases of acute hepatitis C ― United States, 2013 |
| Table 4.3 | Number of newly reported past or present hepatitis C case-reports submitted by states, 2013 |
| Table 4.4 | Reported cases of past or present hepatitis C, by demographic characteristics and laboratory tests – Enhanced Viral Hepatitis Surveillance Sites, 2013 |
| Table 4.5 | Number and rate of hepatitis C-related deaths, by demographic characteristics and year – United States, 2009-2013 |
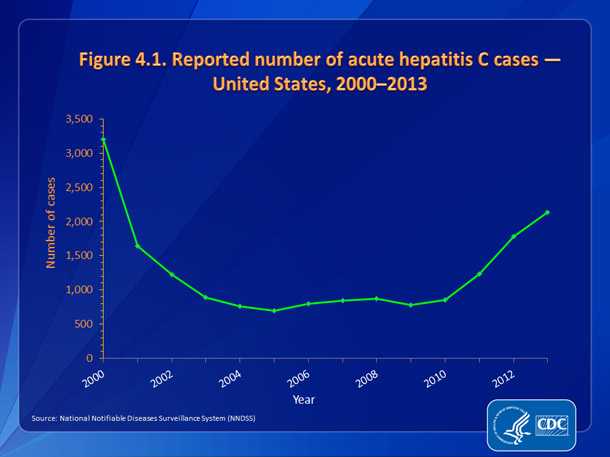
| Slide 4.1 | Reported number of acute hepatitis hepatitis C cases — United States, 2000-2013 |
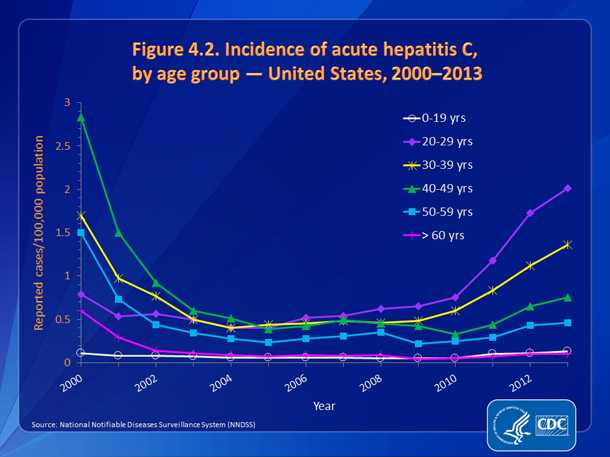
| Slide 4.2 | Incidence of acute hepatitis C, by age group — United States, 2000-2013 |
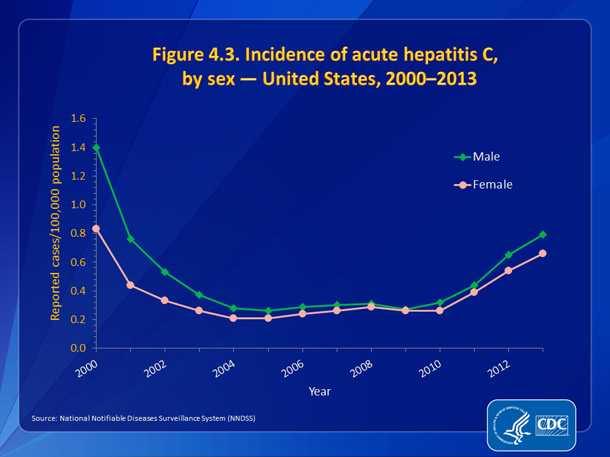
| Slide 4.3 | Incidence of acute hepatitis C, by sex — United States, 2000-2013 |
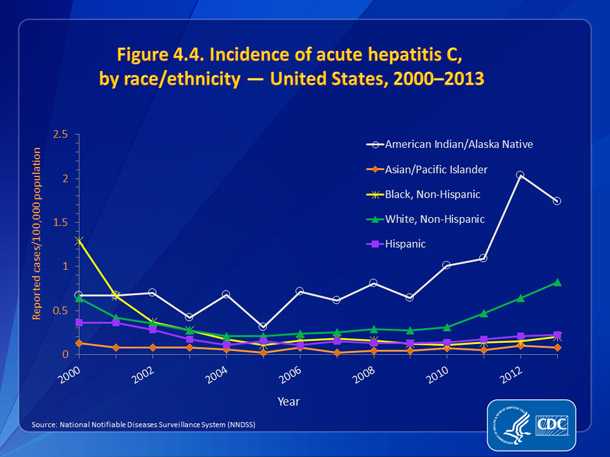
| Slide 4.4 | Incidence of acute hepatitis C, by race/ethnicity — United States, 2000-2013 |
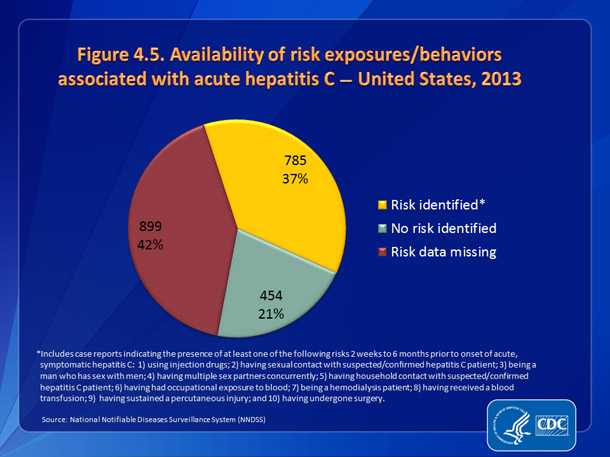
| Slide 4.5 | Availability of information on risk exposures/behaviors associated with acute hepatitis C — United States, 2013 |
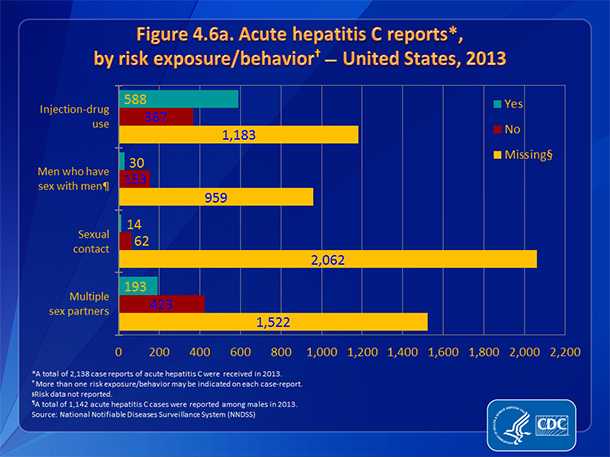
| Slide 4.6a | Acute hepatitis C reports, by risk behavior — United States, 2013 |
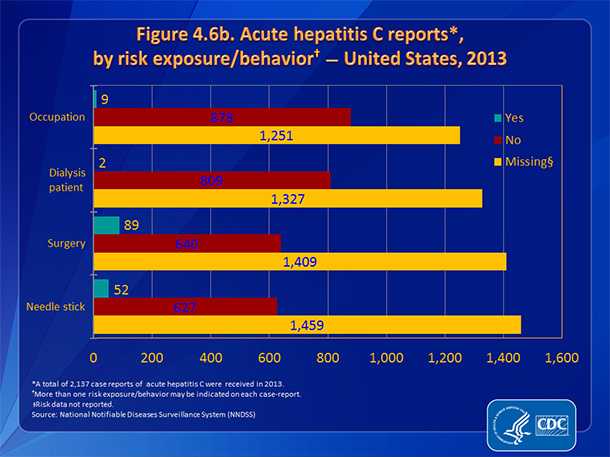
| Slide 4.6b | Acute hepatitis C reports, by risk exposure — United States, 2013 |
Hepatitis C virus
Table 4.1 Reported cases of acute hepatitis C, nationally and by state ― United States, 2009-2013
| State |
2009
|
2010
|
2011
|
2012
|
2013
|
|||||
|---|---|---|---|---|---|---|---|---|---|---|
| Rate* | (No.) | Rate | (No.) | Rate | (No.) | Rate | (No.) | Rate | (No.) | |
|
Alabama
|
0.2
|
(10)
|
0.1
|
(7)
|
0.5
|
(23)
|
0.5
|
(24)
|
0.6 | (30) |
|
Alaska
|
U
|
U
|
U
|
U
|
U
|
U
|
U
|
U
|
U | (U) |
|
Arizona
|
U
|
U
|
U
|
U
|
U
|
U
|
U
|
U
|
U | (U) |
|
Arkansas
|
0.1
|
(2)
|
0
|
(1)
|
0
|
(0)
|
0.2
|
(5)
|
1.0 | (30) |
|
California
|
0.1
|
(43)
|
0.1
|
(32)
|
0.1
|
(48)
|
0.2
|
(63)
|
0.2 | (72) |
|
Colorado
|
0.6
|
(28)
|
0.4
|
(20)
|
0.5
|
(28)
|
0.8
|
(42)
|
0.4 | (21) |
|
Connecticut
|
1.5
|
(53)
|
1.0
|
(37)
|
1.3
|
(47)
|
0.9
|
(34)
|
U | (U) |
|
Delaware
|
U
|
U
|
U
|
U
|
U
|
U
|
U
|
U
|
0.0 | (0) |
|
District of Columbia
|
0.2
|
(1)
|
0.3
|
(2)
|
U
|
U
|
U
|
U
|
U | (U) |
|
Florida
|
0.3
|
(53)
|
0.3
|
(56)
|
0.3
|
(64)
|
0.6
|
(107)
|
0.7 | (134) |
|
Georgia
|
0.3
|
(31)
|
0.3
|
(32)
|
0.5
|
(53)
|
0.8
|
(82)
|
0.5 | (48) |
|
Hawaii
|
U
|
U
|
U
|
U
|
U
|
U
|
U
|
U
|
U | (U) |
|
Idaho
|
0.5
|
(7)
|
0.7
|
(11)
|
0.8
|
(12)
|
0.7
|
(11)
|
0.9 | (14) |
|
Illinois
|
0
|
(6)
|
0
|
(1)
|
0
|
(6)
|
0.2
|
(26)
|
0.3 | (37) |
|
Indiana
|
0.3
|
(22)
|
0.4
|
(27)
|
1.3
|
(84)
|
1.7
|
(110)
|
2.7 | (175) |
|
Iowa
|
0.4
|
(11)
|
0
|
0
|
0
|
(0)
|
0.1
|
(3)
|
U | (U) |
|
Kansas
|
0
|
(1)
|
0.1
|
(2)
|
0.3
|
(8)
|
0.6
|
(16)
|
0.6 | (17) |
|
Kentucky
|
1.5
|
(64)
|
2.5
|
(109)
|
3.2
|
(142)
|
4.1
|
(178)
|
5.1 | (226) |
|
Louisiana
|
0.2
|
(9)
|
0.1
|
(4)
|
0.2
|
(7)
|
0.2
|
(11)
|
0.4 | (19) |
|
Maine
|
0.2
|
(2)
|
0.2
|
(2)
|
0.9
|
(12)
|
0.6
|
(8)
|
0.6 | (8) |
|
Maryland
|
0.4
|
(23)
|
0.4
|
(24)
|
0.6
|
(35)
|
0.7
|
(39)
|
0.9 | (53) |
|
Massachusetts
|
0.2
|
(10)
|
0.2
|
(13)
|
0.3
|
(23)
|
0.6
|
(37)
|
2.6 | (174) |
|
Michigan
|
0.4
|
(35)
|
0.5
|
(45)
|
0.3
|
(32)
|
0.8
|
(76)
|
0.7 | (74) |
|
Minnesota
|
0.3
|
(15)
|
0.3
|
(16)
|
0.3
|
(17)
|
0.6
|
(32)
|
0.9 | (47) |
|
Mississippi
|
U
|
U
|
U
|
U
|
U
|
U
|
U
|
U
|
U | (U) |
|
Missouri
|
0
|
(0)
|
0.1
|
(6)
|
0.1
|
(8)
|
0.1
|
(4)
|
0.1 | (6) |
|
Montana
|
0.1
|
(1)
|
0.4
|
(4)
|
0.9
|
(9)
|
0.9
|
(9)
|
1.6 | (16) |
|
Nebraska
|
0.2
|
(3)
|
0.1
|
(2)
|
0.1
|
(2)
|
0.2
|
(3)
|
0.1 | (2) |
|
Nevada
|
0.2
|
(5)
|
0.3
|
(7)
|
0.4
|
(10)
|
0.4
|
(12)
|
0.3 | (9) |
|
New Hampshire
|
U
|
U
|
U
|
U
|
U
|
U
|
U
|
U
|
U | (U) |
|
New Jersey
|
0.1
|
(7)
|
0.3
|
(28)
|
0.6
|
(53)
|
0.8
|
(71)
|
1.2 | (106) |
|
New Mexico
|
0.3
|
(6)
|
0.7
|
(14)
|
0.7
|
(14)
|
1
|
(21)
|
0.6 | (12) |
|
New York
|
0.3
|
(53)
|
0.3
|
(50)
|
0.3
|
(52)
|
0.5
|
(93)
|
0.7 | (131) |
|
North Carolina
|
0.3
|
(24)
|
0.4
|
(39)
|
0.6
|
(60)
|
0.6
|
(63)
|
0.8 | (79) |
|
North Dakota
|
0.3
|
(2)
|
0
|
(0)
|
0
|
(0)
|
0
|
0
|
0.6 | (4) |
|
Ohio
|
0.2
|
(26)
|
0.1
|
(10)
|
0.1
|
(6)
|
0.1
|
(7)
|
1.0 | (116) |
|
Oklahoma
|
0.7
|
(27)
|
1.1
|
(41)
|
1.4
|
(53)
|
2.1
|
(80)
|
1.0 | (40) |
|
Oregon
|
0.5
|
(19)
|
0.5
|
(19)
|
0.5
|
(20)
|
0.9
|
(37)
|
0.4 | (14) |
|
Pennsylvania
|
0.3
|
(39)
|
0.2
|
(26)
|
0.3
|
(35)
|
0.5
|
(66)
|
0.6 | (81) |
|
Rhode Island
|
U
|
U
|
U
|
U
|
U
|
U
|
U
|
U
|
U | (U) |
|
South Carolina
|
0
|
(1)
|
0
|
(1)
|
0
|
(1)
|
0
|
(1)
|
0.0 | (0) |
|
South Dakota
|
U
|
U
|
U
|
U
|
U
|
U
|
U
|
U
|
0.0 | (1) |
|
Tennessee
|
0.5
|
(33)
|
0.7
|
(46)
|
1.3
|
(83)
|
2
|
(129)
|
1.5 | (98) |
|
Texas
|
0.1
|
(36)
|
0.1
|
(35)
|
0.1
|
(37)
|
0.2
|
(44)
|
0.1 | (28) |
|
Utah
|
0.2
|
(6)
|
0.4
|
(10)
|
0.4
|
(10)
|
0.6
|
(17)
|
0.4 | (11) |
|
Vermont
|
0.2
|
(1)
|
0.3
|
(2)
|
1.0
|
(6)
|
1
|
(6)
|
0.5 | (3) |
|
Virginia
|
0.1
|
(10)
|
0.2
|
(13)
|
0.3
|
(25)
|
0.9
|
(76)
|
0.5 | (41) |
|
Washington
|
0.3
|
(22)
|
0.4
|
(25)
|
0.6
|
(41)
|
0.8
|
(54)
|
0.9 | (63) |
|
West Virginia
|
1.7
|
(31)
|
1.1
|
(21)
|
2.5
|
(46)
|
3
|
(55)
|
3.1 | (58) |
|
Wisconsin
|
0.1
|
(3)
|
0.2
|
(10)
|
0.3
|
(15)
|
0.5
|
(26)
|
0.7 | (40) |
|
Wyoming
|
0
|
(0)
|
0
|
(0)
|
0.4
|
(2)
|
U
|
U
|
U | (U) |
|
Total
|
0.3
|
(781)
|
0.3
|
(850)
|
0.4
|
(1,229)
|
0.6
|
(1,778)
|
0.7 | (2,138) |
*Rate per 100,000 population.
U=No data available for reporting.
Source: CDC, National Notifiable Diseases Surveillance System.
Table 4.2 Clinical characteristics of reported cases of acute hepatitis C ― United States, 2013
| Clinical characteristic |
Availability of valid data† for clinical characteristic
|
Cases with clinical characteristic§
|
||
|---|---|---|---|---|
|
No.
|
%
|
No.
|
%
|
|
|
Jaundice
|
1,491 | 69.7 | 963 | 64.6 |
|
Hospitalized for hepatitis C
|
1,382 | 64.6 | 794 | 57.5 |
|
Died from hepatitis C
|
1,291 | 60.4 | 3 | 0.2 |
*A total of 2,138 hepatitis C cases were reported during 2013.
†Case reports for which questions regarding clinical characteristics were answered with “yes” or “no.” Reports with any other response were excluded.
§Numbers and percentages represent only those case reports for which data regarding clinical characteristics were available; numbers likely are underestimates.
Source: CDC, National Notifiable Diseases Surveillance System.
Table 4.3 Number of newly reported past or present hepatitis C case-reports submitted by states, 2013
| Jurisdiction | No. chronic hepatitis C case reports submitted |
Data Source |
|---|---|---|
| Colorado | 2,982 | State-provided |
| Connecticut¶ | 2,749 | State-provided |
| Florida¶ | 19,759 | NNDSS |
| Kansas | 1,532 | State-provided |
| Maine** | 1,265 | State-provided |
| Michigan¶ | 6,719 | State-provided |
| Minnesota** | 1,601 | NNDSS |
| Montana¶ | 1,141 | State-provided |
| New Jersey** | 6,580 | NNDSS |
| New Mexico | 959 | State-provided |
| New York (minus New York City)** |
6,633 | State-provided |
| New York City** | 6,822 | State-provided |
| Oregon** | 3,772 | State-provided |
| Pennsylvania¶ | 8,882 | State-provided |
| South Carolina†† | 3,238 | NNDSS |
| South Dakota** | 405 | NNDSS |
| West Virginia** | 4,503 | State-provided |
|
Total
|
79,542
|
Abbreviation: NNDSS, National Notifiable Diseases Surveillance System
* For case-definition, see http://wwwn.cdc.gov/nndss/script/ConditionList.aspx?Type=0&Yr=2012.
† Reports may not reflect unique cases. §Jurisdictions that gave permission to report their number of chronic HBV cases
¶ Includes confirmed and probable case reports only.
** Includes confirmed case reports only.
†† Includes confirmed, probable, and suspect case reports.
Table 4.4. Reported cases of past or present hepatitis C, by demographic characteristics and laboratory tests – Enhanced Viral Hepatitis Surveillance Sites, 2013
| Category | Massa- chusetts No. (%) |
Michigan No. (%) |
New York State† No. (%) |
Philadel- phia No. (%) |
San Francisco No. (%) |
Washing- ton§ No. (%) |
Total No. (%) |
|---|---|---|---|---|---|---|---|
| Sex | |||||||
| Female | 2,013 39.1% |
2,188 35.4% |
2,430 36.6% |
457 35.9% |
389 30.3% |
1,119 41.0% |
8,596 37.0% |
| Male | 3,116 60.6% |
3,976 64.3% |
4,172 62.9% |
813 63.9% |
879 68.6% |
1,534 56.2% |
14,490 62.3% |
| Unknown/ missing |
17 0.3% |
17 0.3% |
31 0.5% |
3 0.2% |
14 1.1% |
76 2.8% |
158 0.7% |
| Race/ethnicity | |||||||
| American Indian/ Alaskan Native, non-Hispanic (NH) |
20 0.4% |
66 1.1% |
23 0.3% |
1 0.1% |
16 1.2% |
121 4.4% |
247 1.1% |
| Asian/Pacific Islander, NH |
86 1.7% |
22 0.4% |
72 1.1% |
22 1.7% |
60 4.7% |
23 0.8% |
285 1.2% |
| Black, NH | 208 4.0% |
1,228 19.9% |
578 8.7% |
341 26.8% |
230 17.9% |
35 1.3% |
2,620 11.3% |
| White, NH | 2,492 48.4% |
2,923 47.3% |
2,851 43.0% |
219 17.2% |
455 35.5% |
712 26.1% |
9,652 41.5% |
| Hispanic | 347 6.7% |
85 1.4% |
430 6.5% |
86 6.8% |
96 7.5% |
72 2.6% |
1,116 4.8% |
| Other, NH | 115 2.2% |
78 1.3% |
88 1.3% |
7 0.5% |
14 1.1% |
18 0.7% |
320 1.4% |
| Unknown/ missing |
1,878 36.5% |
1,779 28.8% |
2,591 39.2% |
597 46.9% |
411 32.1% |
1,748 64.1% |
9,004 38.7% |
| Age group, years | |||||||
| 0-14 | 41 0.8% |
36 0.6% |
13 0.2% |
9 0.7% |
0 0.0% |
8 0.3% |
107 0.5% |
| 15-24 | 798 15.5% |
567 9.2% |
724 10.9% |
78 6.1% |
32 2.5% |
249 9.1% |
2,448 10.5% |
| 25-39 | 1,762 34.2% |
1,285 20.8% |
1,815 27.4% |
238 18.7% |
209 16.3% |
609 22.3% |
5,918 25.5% |
| 40-54 | 1,353 26.3% |
1,611 26.1% |
1,809 27.3% |
411 32.3% |
437 34.1% |
969 35.5% |
6,590 28.4% |
| 55+ | 1,192 23.2% |
2,682 43.4% |
2,260 34.1% |
537 42.2% |
597 46.6% |
891 32.6% |
8,159 35.1% |
| Unknown/ missing |
0 0.0% |
0 0.0% |
12 0.2% |
0 0.0% |
7 0.5% |
3 0.1% |
22 0.1% |
| Hepatitis C laboratory testing¶ | |||||||
| Anti-HCV+ | 4,145 80.5% |
2,367 38.3% |
5,165 77.9% |
890 69.9% |
896 69.9% |
1,640 60.1% |
15,103 65.0% |
| HCV RNA + | 3,820 74.2% |
1,402 22.7% |
5,575 84.0% |
1,120 88.0% |
780 60.8% |
1,476 54.1% |
14,173 61.0% |
| Total no. cases | 5,146 | 6,181 | 6,633 | 1,273 | 1,282 | 2,729 | 23,244 |
| 2013 Estimated population total** |
6,692,824 | 9,895,622 | 11,245,290 | 1,553,165 | 837,442 | 5,405,750 | 35,630,093 |
| Rate per 100,000 population |
76.9 | 62.5 | 59.0 | 82.0 | 153.1 | 50.5 | 65.2 |
* Past or present hepatitis C data from Florida, one of the 7 funded sites, were not included in this table. Past or present hepatitis C data from all funded sites, including Florida, will be published in an updated table in July.
† Cases and population estimates from New York excluded those who resided in New York City.
§ Cases from Washington excluded Snohomish County, Pierce County, and 90% of King County.
¶ Cases can be reported with more than one laboratory test result. The denominator used to calculate proportions was the total number of cases reported for each site.
** Population estimates for the United States: https://wonder.cdc.gov/bridged-race-population.html. Population estimates from Washington excluded Snohomish and Pierce Counties.
Table 4.5. Number and rate of hepatitis C-related deaths, by demographic characteristics and year – United States, 2009-2013
| Demographic characteristic |
2009
|
2010
|
2011
|
2012
|
2013
|
||||||
|---|---|---|---|---|---|---|---|---|---|---|---|
| No. | Rate | No. | Rate | No. | Rate | No. | Rate | No. | Rate | ||
| Age Group (years) |
0–34 | 116 | 0.08 | 117 | 0.08 | 128 | 0.09 | 158 | 0.11 | 121 | 0.08 |
| 35–44 | 828 | 1.99 | 712 | 1.73 | 696 | 1.71 | 622 | 1.54 | 573 | 1.42 | |
| 45–54 | 5,469 | 12.26 | 5,171 | 11.49 | 5,073 | 11.34 | 4,749 | 10.73 | 4,344 | 9.93 | |
| 55–64 | 6,683 | 19.21 | 7,431 | 20.37 | 8,330 | 21.89 | 9,235 | 23.93 | 9,899 | 25.18 | |
| 65–74 | 1,824 | 8.77 | 1,901 | 8.75 | 2,136 | 9.5 | 2,515 | 10.49 | 3,004 | 11.91 | |
| ≥75 | 1,333 | 7.01 | 1,293 | 6.97 | 1,357 | 7.18 | 1,369 | 7.15 | 1,425 | 7.31 | |
| Race | White§ | 12,682 | 4.43 | ||||||||
| Black¶ | 2,908 | 7.80 | |||||||||
| Non-White, non-Black** | 663 | 3.61 | |||||||||
| Race/ Ethnicity |
White, non- Hispanic |
10,575 | 4.03 | 11,196 | 4.19 | 11,839 | 4.35 | 12,219 | 4.40 | ||
| Black, non- Hispanic |
2,981 | 7.72 | 3,167 | 7.89 | 3,232 | 7.81 | 3,520 | 8.35 | |||
| Hispanic | 2,318 | 6.83 | 2,555 | 7.15 | 2,668 | 7.19 | 2,699 | 6.91 | |||
| Asian/ Pacific Islander |
440 | 3.30 | 455 | 3.14 | 472 | 3.15 | 495 | 3.09 | |||
| American Indian/ Alaskan Native |
248 | 9.90 | 275 | 10.61 | 313 | 11.81 | 324 | 12.22 | |||
| Sex | Male | 11,517 | 6.91 | 11,781 | 6.81 | 12,651 | 7.11 | 13,300 | 7.31 | 13,745 | 7.40 |
| Female | 4,736 | 2.65 | 4,846 | 2.63 | 5,070 | 2.7 | 5,350 | 2.77 | 5,623 | 2.85 | |
|
Overall
|
16,235 | 4.70 | 16,627 | 4.65 | 17,721 | 4.82 | 18,650 | 4.96 | 19,368 | 5.03 | |
* Rates for race, sex, and overall total are age-adjusted per 100,000 U.S. standard population in 2000.
† Cause of death is defined as the underlying cause of death or one of the multiple causes of death and is based on the International Classification of Diseases, 10th Revision (ICD-10) codes B17.1, and B18.2 (hepatitis C).
§ Two deaths in 2010, one death in 2011, two deaths in 2012, and two deaths in 2013 are not represented under the age category due to missing age data.
¶ The race category "White" Included white, non-Hispanic and white Hispanic. The race category "Black" included black, non-Hispanic and black Hispanic. The race category "Non-White, non-Black" included all other races.
** The race/ethnicity category was added starting in 2010 to incorporate bridged race categories. 65 deaths in 2010, 73 deaths in 2011, 126 deaths in 2012, and 111 deaths in 2013 are not represented under the race/ethnicity category due to missing race and/or ethnicity data.
Source: CDC. National Vital Statistics System.
All seven figure slides in PowerPoint 2007 format [PPTX – 368 KB]
- Page last reviewed: May 31, 2015
- Page last updated: August 4, 2016
- Content source: