Skip directly to search Skip directly to A to Z list Skip directly to navigation Skip directly to page options Skip directly to site content

Figures

This website is archived for historical purposes and is no longer being maintained or updated.

CDC Report: Mental Illness Surveillance Among Adults in the United States

Source: Centers for Disease Control and Prevention. [Mental Illness Surveillance Among Adults in the United States.] MMWR 2011;60(Suppl).

Figure 1

Prevalence of current depression* among adults aged ≥18 years, by state quartile — Behavioral Risk Factor Surveillance System, United States, 2006§
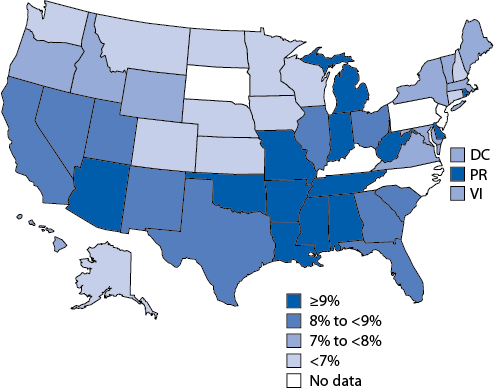
This figure is a map of the United States showing the prevalence of current depression among adults aged ≥18 years, by state quartile, using data from the 2006 Behavioral Risk Factor Surveillance System. The prevalence of depression was generally highest in the southeastern states Current depression was defined as a Patient Health Questionnaire-8 severity score of ≥10. Quartiles are based on point estimates. For Arizona, Colorado, Idaho, Illinois, Massachusetts, New York, and Ohio, data are from 2008.
  • * Patient Health Questionnaire-8 severity score of ≥10.
  • Quartiles based on point estimates.
  • § For Arizona, Colorado, Idaho, Illinois, Massachusetts, New York, and Ohio, data are from 2008.

Figure 2

Prevalence of serious psychological distress* among adults aged ≥18 years, by state quartile — Behavioral Risk Factor Surveillance System, United States, 2007§
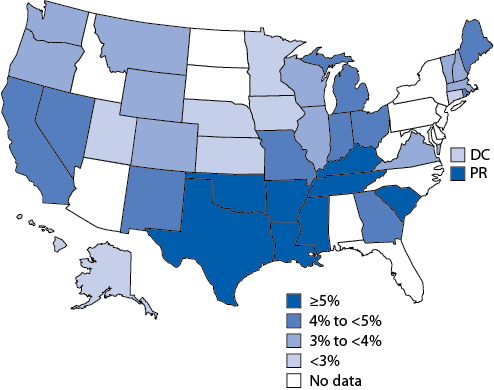
Alternate Text: This figure is a map of the United States showing the prevalence of serious psychological distress among adults aged ≥18 years, by state quartile, using data from the 2007 Behavioral Risk Factor Surveillance System. The prevalence of serious psychological distress was generally highest in the southeastern states. Serious psychological distress was defined as a Kessler-6 score of ≥13. Quartiles are based on point estimates (see Table 9). For Tennessee and Utah, data are from 2009.
  • * Kessler-6 score of ≥13.
  • For Tennessee and Utah, data are from 2009.
  • § Quartiles based on point estimates.

Figure 3

Mean number of mentally unhealthy days* during past 30 days among adults aged ≥18 years, by state quartile — Behavioral Risk Factor Surveillance System, United States, 2009
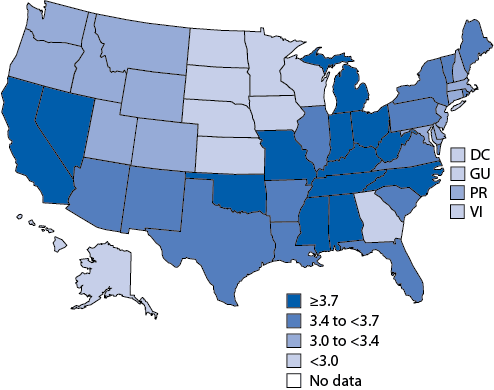
This figure is a map of the United States showing the mean number of mentally unhealthy days during past 30 days among adults aged ≥18 years, by state quartile, using data from the 2009 Behavioral Risk Factor Surveillance System. The mean number of mentally unhealthy days was highest in the southeastern states The survey question was: "Now thinking about your mental health, which includes stress, depression, and problems with emotions, for how many days during the last 30 days was your mental health not good?"
  • * Survey question: "Now thinking about your mental health, which includes stress, depression, and problems with emotions, for how many days during the last 30 days was your mental health not good?"
Top