Tribal Motor Vehicle Injury Prevention Programs for Reducing Disparities in Motor Vehicle–Related Injuries
Corresponding author: Bethany A. West, Division of Unintentional Injury Prevention, National Center for Injury Prevention and Control, CDC. Telephone: 770-488-0602; E-mail: bwest2@cdc.gov.
Summary
A previous analysis of National Vital Statistics System data for 2003–2007 that examined disparities in rates of motor vehicle–related death by race/ethnicity and sex found that death rates for American Indians/Alaska Natives were two to four times the rates of other races/ethnicities. To address the disparity in motor vehicle–related injuries and deaths among American Indians/Alaska Natives, CDC funded four American Indian tribes during 2004–2009 to tailor, implement, and evaluate evidence-based road safety interventions. During the implementation of these four motor vehicle–related injury prevention pilot programs, seat belt and child safety seat use increased and alcohol-impaired driving decreased.
Four American Indian/Alaska Native tribal communities—the Tohono O'odham Nation, the Ho-Chunk Nation, the White Mountain Apache Tribe, and the San Carlos Apache Tribe—implemented evidence-based road safety interventions to reduce motor vehicle–related injuries and deaths. Each community selected interventions from the Guide to Community Preventive Services and implemented them during 2004–2009. Furthermore, each community took a multifaceted approach by incorporating several strategies, such as school and community education programs, media campaigns, and collaborations with law enforcement officers into their programs. Police data and direct observational surveys were the main data sources used to assess results of the programs. Results included increased use of seat belts and child safety seats, increased enforcement of alcohol-impaired driving laws, and decreased motor vehicle crashes involving injuries or deaths. CDC's Office of Minority Health and Health Equity selected the intervention analysis and discussion as an example of a program that might be effective for reducing motor vehicle-related injury disparities in the United States.
The Guide to Community Preventive Services recognizes these selected interventions as effective; this report examines the feasibility and transferability for implementing the interventions in American Indian/Alaska Native tribal communities. The findings in this report underscore the effectiveness of community interventions to reduce motor vehicle crashes among selected American Indian/Alaska Native communities.
Introduction
Motor vehicle crashes (MVCs) are a leading cause of death for children, teenagers, and young adults in the United States, and some U.S. populations are disproportionately affected (1). A previous analysis of National Vital Statistics System data for 2003–2007 that examined disparities in rates of MVC-related death by race/ethnicity and sex found large disparities among American Indians/Alaska Natives, with death rates two to four times the rates for other races/ethnicities (2).
Previous reports have documented several factors that place American Indians/Alaska Natives at increased risk for MVC-related injuries and deaths, including low rates of seat belt use and child safety seat use and a high prevalence of alcohol-impaired driving (3–5). In 2006, an observational study found that seat belt use among American Indians/Alaska Natives was approximately 62% (4), compared with 81% for the general U.S. population (6). Research on child safety seat use in 2004 found that approximately 66% of fatally injured American Indian/Alaska Native children aged <5 years were unrestrained at the time of the crash (3), compared with 35% in the general population (7). In 2006, data examining MVCs involving alcohol-impaired driving found that 48% of MVC-related fatalities among American Indians/Alaska Natives occurred in alcohol-related crashes, the highest percentage for any race/ethnicity (5).
Effective interventions to increase seat belt use include primary enforcement seat belt laws and enhanced enforcement programs; interventions to increase child safety seat use include child safety seat use laws and and distribution of safety seats plus education programs; and interventions to decrease alcohol-impaired driving include enforcing 0.08% blood alcohol concentration (BAC) laws, minimum legal drinking age laws, sobriety checkpoints, and zero tolerance laws for drivers aged <21 years (8).
To address disparities in MVC-related injuries and deaths among American Indians/Alaska Natives, CDC funded projects within four American Indian/Alaska Native tribes—the Tohono O'odham Nation (TON), the Ho-Chunk Nation (HCN), the White Mountain Apache Tribe (WMAT), and the San Carlos Apache Tribe (SCAT)—during 2004–2009 to tailor, implement, and evaluate evidence-based road safety interventions. The four tribes are in Arizona (TON, WMAT, SCAT) and Wisconsin (HCN) (Figures 1 and 2). The TON, located in the southwestern corner of Arizona on approximately 2.8 million acres, is the second largest reservation in the United States. The TON comprises approximately 28,000 tribal members. The WMAT and SCAT are both located in eastern Arizona. The WMAT sits on approximately 1.67 million acres and comprises about 16,000 tribal members, and the SCAT is located on 1.8 million acres and has approximately 14,000 tribal members. Finally, the HCN is largely concentrated in midwestern Wisconsin on approximately 13,000 acres in 14 counties and comprises a tribal membership of approximately 7,000. The HCN project focused on five rural counties (i.e., Jackson, Juneau, Monroe, Sauk, and Wood).
CDC's Office of Minority Health and Health Equity selected the intervention analysis and discussion that follows to provide an example of a program that might be effective in reducing disparities in motor vehicle–related injuries in the United States. Criteria for selecting this program are described in the Background and Rationale for this supplement (9).
Methods
Intervention
Each tribe was expected to tailor at least two interventions chosen from the Guide to Community Preventive Services (Community Guide) (8) to its community. The Community Guide is a resource of evidence-based findings and recommendations about community-based health and injury prevention interventions. The recommendations derive from a rigorous, replicable systematic review process that evaluates the strengths and limitations of existing research for community-based health promotion and disease prevention programs, services, and policies. For motor vehicle safety, the Community Guide includes recommendations for several interventions designed to increase use of seat belts and child safety seats and decrease alcohol-impaired driving (8).
CDC encouraged each tribe to take a multifaceted approach by incorporating education and awareness-raising activities, media campaigns, and enforcement components into its program (Table). For example, education activities included programs at schools as well as community information and awareness raising through safety expos and health fairs; media campaigns included billboards, radio public service announcements (PSAs), and newspaper articles; and enforcement components included enhanced enforcement focusing on specific issues, such as alcohol-impaired driving or seat belt nonuse, and aimed to increase the number of citations for these illegal behaviors.
TON passed a primary seat belt law in 2005 (no CDC funds were used for this activity). To support implementation of the new law, TON focused a comprehensive media campaign that included billboards, radio PSAs, and articles in the tribal newspaper to increase seat belt use and collaborated with tribal police on enhanced police enforcement campaigns. Enhanced enforcement campaigns involve targeted police enforcement of a specific illegal behavior, such as seat belt nonuse, with increased resources and staffing during specific times. TON not only focused these campaigns on increasing seat belt use (e.g., Click-It or Ticket programs) but also on reducing alcohol-impaired driving through driving under the influence (DUI) saturation patrols and sobriety checkpoints. In addition, TON held community events and health fairs in which motor vehicle education stations or booths helped to inform the community about laws and safety benefits of wearing seat belts, as well as the risks associated with alcohol-impaired driving. Finally, TON conducted child safety seat distribution and education programs and community education and awareness-raising activities through safety expos and health fairs.
HCN set goals to increase use of seat belts and child safety seats. An important component of the HCN's program was partnership with local county police departments to educate and train police officers to increase enforcement of laws pertaining to use of seat belts and child safety seats. HCN also held several child safety seat education and distribution events. HCN implemented a comprehensive media campaign that included newspaper and radio ads, radio PSAs, seat belt road signs, mobile media, and billboards. Additionally, HCN educated the community through events, such as crash simulations, safety expos, health fairs, school events, and child passenger safety clinics.
WMAT focused on increasing seat belt use and decreasing alcohol-impaired driving through enhanced police enforcement and sobriety checkpoints and implementing a comprehensive media campaign that included radio and newspaper ads and periodic radio PSAs. WMAT trained 29 police officers on the installation, education, and enforcement of child safety and booster seats.
SCAT focused on reducing alcohol-impaired driving and increasing use of seat belts and child safety seats among tribal members. Media campaigns, including radio and newspaper ads, and flyers, posters, and sponsored booths to educate the community at local events complemented their enforcement efforts to reduce alcohol-impaired driving. SCAT used sobriety checkpoints and enhanced police enforcement to decrease alcohol-impaired driving and increase restraint use.
Data Analyses
Observational surveys of seat belt use conducted by tribal staff (all tribes) followed the University of North Carolina/Indian Health Service Seat Belt Use Observational Survey Protocol (10). Observations of seat belt use were recorded for drivers and front seat passengers. The proportion of seat belt use was calculated by dividing the number of observed belted occupants by the total number of observations. In addition, observational surveys of child safety seat use (TON, HCN) followed the guidelines outlined by the Indian Health Service Ride Safe Program (11,12).
The numbers of community observational surveys conducted by the tribal programs varied by year and tribe; ranges by tribe are presented here. Observational surveys among TON drivers and passengers ranged from 1,000 observations in 2005 to 3,378 observations in 2008; for HCN, from 1,177 in 2007 to 1,924 in 2009; and for WMAT, from 636 in 2004 to 1,971 in 2006. Observational surveys of child safety seat use also were conducted by TON and HCN. For TON, total observations of child safety seat use ranged from 246 in fall 2006 to 261 in fall 2005; for HCN, from 31 in fall 2006 to 88 in spring 2008.
Tribal police data were used to measure changes in overall numbers of MVCs (SCAT), nighttime MVCs (SCAT), MVCs involving injuries (TON) or injuries and deaths (SCAT), and DUI arrests (SCAT). Tribal police data also were used to count the total number of sobriety checkpoints and vehicles stopped during the checkpoints (WMAT and SCAT), DUI arrests (TON), citations for seat belt nonuse (HCN), and enhanced enforcement campaigns (HCN) during the program period. Additionally, WMAT measured knowledge and behavior change among 29 police officers by using surveys immediately before and after the child safety seat and booster seat installation, education, and enforcement training sessions. The surveys asked police officers how confident they were in educating the community about proper use of child safety seats and about properly identifying the requirements for rear-facing child safety seats and booster seats.
Finally, SCAT conducted a cost–benefit analysis to further evaluate its program. Data from the Arizona Crash Outcome Data Evaluation System (CODES) were used to compare all program costs with the dollar value of ensuing benefits. The analysis used a human capital approach and benefits in terms of direct and indirect costs saved from reduced numbers of MVCs, fewer injuries per crash, and reduced injury severity were calculated from a societal perspective. Arizona CODES data include probabilistically linked police crash report data, emergency medical systems data, emergency department and hospital records data, and rehabilitation and long-term care data. These CODES data contain direct and indirect cost information, including costs of medical expenses (such as professional, hospital, emergency department, drug, rehabilitation, and long-term care costs), and police, fire, insurance administration, loss of wages, loss of household work, legal and court, and property damage costs (13).
Results
On the TON reservation from 2005 to 2009, observed driver use of seat belts increased 73% (from 45% to 77%), and passenger use of seat belts increased 85% (from 37% to 68%) (Figure 3). Additionally, observed use of child safety seats increased 45% (from 34% to 49%). From 2004 to 2008, TON documented a 36% decrease in crashes with injuries. Enhanced enforcement activities resulted in 388 DUI arrests.
During 2005–2009, observed HCN driver use of seat belts increased 38% (from 50% to 69%), and passenger use of seat belts increased 94% (from 33% to 63%) (Figure 4). Observed use of child safety seats increased 85% (from 41% to 76%). During the program period, activities included 13 enhanced seat belt use enforcement campaigns that resulted in 151 citations for seat belt nonuse.
From 2004 to 2008, observed WMAT driver use of seat belts increased 315% (from 13% to 54%), and passenger use of seat belts increased 220% (from 10% to 32%) (Figure 5). In evaluations of police enforcement training about child passenger safety, the percentage of officers who reported being extremely confident about educating the community in the proper use of child safety seats increased 314% (from 14% to 58%), and officer's proper identification of requirements for rear-facing child safety seats and booster seats increased by 51% (from 59% to 89%) and 13% (from 24% to 27%), respectively. In addition, from 2006 to 2008, enhanced alcohol-impaired driving enforcement activities included conducting 55 sobriety checkpoints and stopping approximately 28,000 vehicles to check for alcohol-impaired drivers.
For SCAT from 2004 to 2008, observed driver seat belt use increased 46% (from 13% to 19%) and MVCs decreased 29% (Figure 6). Furthermore, nighttime MVCs decreased 27%, and MVCs involving injuries and/or fatalities decreased 31%. During 2004–2008, SCAT conducted 39 sobriety checkpoints and stopped approximately 18,000 vehicles. In addition, total DUI arrests increased 52% during this period. In addition, SCAT passed two motor vehicle safety resolutions in 2007 (no CDC funds were used for these activities). In the first, the legal limit in the BAC law was lowered from 0.10% to 0.08%, making driving with a BAC ≥0.08% illegal. The second established a primary seat belt law for the SCAT Reservation that allowed officers to pull over a driver and issue a citation solely because of an unbuckled occupant, rather than needing to pull over a driver for another offense before issuing a citation for a seat belt violation. A cost–benefit analysis of the SCAT program documented a savings of $2,710,000 during the project period, including $360,000 in direct medical costs and $2,350,000 in other costs (e.g., foregone earnings because of death or injury). Moreover, the program had a lifetime cost–benefit ratio of 1:9.54; in other words, for every $1 spent, a lifetime benefit of $9.54 was saved from fewer MVCs, fewer injuries per crash, and reduced injury severity (13).
Discussion
MVCs and MCV-related injuries and deaths are preventable. Seat belts can reduce the risk for death in a crash by approximately half, and child safety seats can reduce the risk for death to infants by 71% and to toddlers by 54% (7,14). Moreover, sobriety checkpoints reduce fatal alcohol-related crashes by approximately 20% (15). During 2004–2009, evidence-based road safety interventions were implemented in four American Indian/Alaska Native tribes. Over this time period, seat belt and child safety seat use increased and alcohol-impaired driving decreased in these communities. However, these observational studies do not provide information regarding causal association. As CDC continues to address disparities in motor vehicle–related injuries and deaths, the successes and lessons learned from these programs will be applied to improve future programs.
Lessons learned from the first four programs included the need for several strong partners, including police and tribal leaders; a full-time tribal program coordinator; evaluation consultants; and local Indian Health Service and tribal environmental health professionals who can provide on-the-ground technical assistance. Additionally, implementation of evidence-based strategies and a multicomponent approach that includes elements of media, education, and enforcement were thought to contribute to program successes. These lessons learned might—or might not—transfer for use in future programs because of the diverse cultural, environmental, social, and political characteristics of the 566 federally recognized sovereign American Indian/Alaska Native tribes in the United States.
To better understand what is needed to implement successful motor vehicle–related injury prevention programs across diverse tribal populations, CDC will continue to work with tribal communities to tailor, implement, and evaluate evidence-based interventions. CDC funded six new tribes, one tribal organization, and the Alaska Native Consortium during 2010–2014 to apply approaches similar to those used by the four tribes described in this report: Caddo Nation of Oklahoma, California Rural Indian Health Board, Colorado River Indian Tribes, Hopi Tribe of Arizona, Oglala Sioux Tribe of South Dakota, Rosebud Sioux Tribe of South Dakota, Sisseton-Wahpeton Oyate of the Lake Traverse Reservation, and Southeast Alaska Regional Health Consortium. CDC plans to use the best practices and lessons learned from all 12 tribal programs, including the four described here, to advise and guide future tribal programs to prevent motor vehicle–related injuries.
Limitations
The findings in this report are subject to at least two limitations. First, uniform data collection on the same measures across all four tribes was not possible because of differences in information collected by the police and data accessibility issues. Therefore, the results cannot be compared between tribes. Second, the cost estimates used in the cost–benefit analysis are conservative because of difficulty in obtaining complete cost data; therefore the total savings reported probably are underestimated.
Conclusion
Tailoring evidence-based interventions (e.g., through culturally appropriate messages, by using important tribal forums to raise awareness, and by establishing unique enforcement partnerships) to prevent motor vehicle–related injuries was a promising approach for these pilot programs. Continued translation and application of effective interventions in other tribal populations is necessary to further reduce disparities in motor vehicle–related injuries and deaths.
Acknowledgments
The authors acknowledge the many partners involved in these programs, especially the tribal program coordinators, Nicole Thunder, Abby Burnette, Priscilla Lopez, and Christine Reede; Indian Health Service injury prevention specialists and tribal environmental health officers, Gordon Tsatoke, Stephen Piontkowski, Jeff Dickson, Jeff Severn, Don Williams, and Rob Voss; program evaluators, Larry Berger, Carolyn Crump, and Robert Letourneau; CDC project officer, David Wallace; and the many tribal leaders, police officers, and health department staff who contributed to the success of these programs.
References
- CDC. Web-based Injury Statistics Query and Reporting System (WISQARS) [online database]. Atlanta, GA: US Department of Health and Human Services, CDC, National Center for Injury Prevention and Control; 2012. Available at http://www.cdc.gov/injury/wisqars/index.html.
- CDC. Motor vehicle–related deaths—United States, 2003–2007. In: CDC health disparities and inequalities report. MMWR 2011;60(Suppl; January 14, 2011).
- National Highway Traffic Safety Administration. Race and ethnicity in fatal motor vehicle traffic crashes 1999–2004. Washington, DC: US Department of Transportation, National Highway Traffic Safety Administration; 2006. Available at http://www-nrd.nhtsa.dot.gov/Pubs/809956.pdf.
- National Highway Traffic Safety Administration. 2006 Seat belt use estimate for Native American tribal reservations. Washington, DC: US Department of Transportation, National Highway Traffic Safety Administration; 2008. Available at http://www.nhtsa.gov/DOT/NHTSA/Traffic%20Injury%20Control/Articles/Associated%20Files/810967.pdf.
- National Highway Traffic Safety Administration. Traffic safety facts: race and ethnicity 2006 data. Washington, DC: US Department of Transportation, National Highway Traffic Safety Administration; 2009. Available at http://www-nrd.nhtsa.dot.gov/Pubs/810995.pdf.
- National Highway Traffic Safety Administration. Traffic safety facts: seat belt use in 2006—overall results. Washington, DC: US Department of Transportation, National Highway Traffic Safety Administration; 2006. Available at http://www-nrd.nhtsa.dot.gov/Pubs/810677.pdf.
- National Highway Traffic Safety Administration. Traffic safety facts: children 2004 data. Washington, DC: US Department of Transportation, National Highway Traffic Safety Administration; 2005. Available at http://www-nrd.nhtsa.dot.gov/Pubs/809906.pdf.
- Task Force on Community Preventive Services. Motor vehicle–related injury prevention. Atlanta, GA: Task Force on Community Preventive Services; 2010. Available at http://www.thecommunityguide.org/mvoi/index.html.
- CDC. Background and rationale. In: Strategies for reducing health disparities—selected CDC-sponsored interventions, United States, 2014. MMWR 2014;63(No. Suppl 1).
- Bowling JM, Crump CE, Cannon M, et al. Seatbelt observational survey protocol development project—final report. Chapel Hill, NC: The University of North Carolina at Chapel Hill; 2005. Available at http://www.npaihb.org/images/epicenter_docs/injuryprevention/UNCSeatBeltProtocol.pdf.
- Letourneau RJ, Crump CE, Bowling JM, et al. Ride Safe: a child passenger safety program for American Indian/Alaskan Native children. Matern Child Health J 2008;12:55–63.
- Indian Health Service. Ride Safe child passenger safety program manual. 2011. Available at http://www.ihs.gov/MedicalPrograms/InjuryPrevention/documents/Binder3.pdf.
- Piland NF, Berger LR, Naumann RM. Economic costs of motor vehicle crashes (MVCs) and economic benefits of prevention for the San Carlos Apache Tribe. IHS Primary Care Provider 2010;35:272–7.
- National Highway Traffic Safety Administration. Final regulatory impact analysis amendment to Federal Motor Vehicle Safety Standard 208. Passenger car front seat occupant protection. Washington, DC: US Department of Transportation, National Highway Traffic Safety Administration; 1984. Available at http://www-nrd.nhtsa.dot.gov/pubs/806572.pdf.
- Elder RW, Shults RA, Sleet DA, et al. Effectiveness of sobriety checkpoints for reducing alcohol-involved crashes. Traffic Injury Prevention 2002;3:266–74.
FIGURE 1. Location of the Tohono O'odham Nation, White Mountain Apache Tribe, and the San Carlos Apache Tribe reservations — Arizona
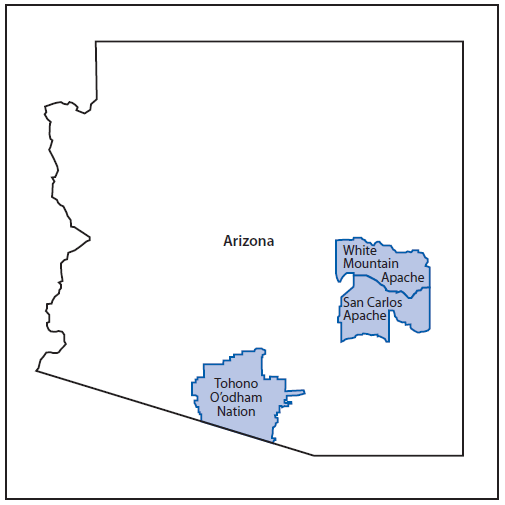
Alternate Text: The figure present a map of Arizona and highlights the location of the White Mountain Apache, San Carlos Apache, and Tohona O'odham Nation reservations.
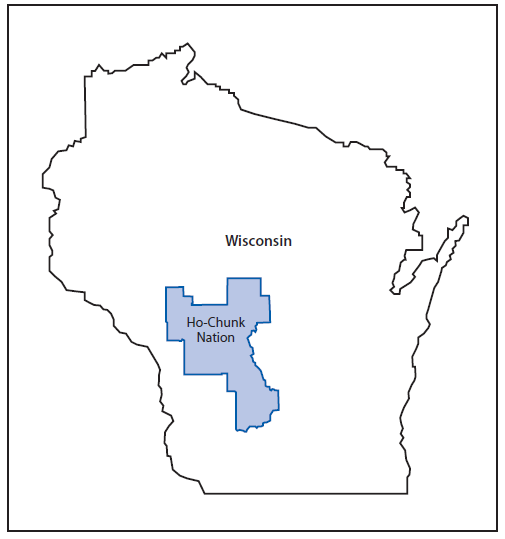
* The Ho-Chunk Nation is largely concentrated on approximately 13,000 acres in 14 counties. The project focused on five rural counties (i.e., Jackson, Juneau, Monroe, Sauk, and Wood).
Alternate Text: The figure presents a map of Wisconsin and highlights the location of the Ho-Chunk Nation reservation.
FIGURE 3. Percentage of observed driver and passenger seat belt use — Tohono O'odham Nation, 2005–2009
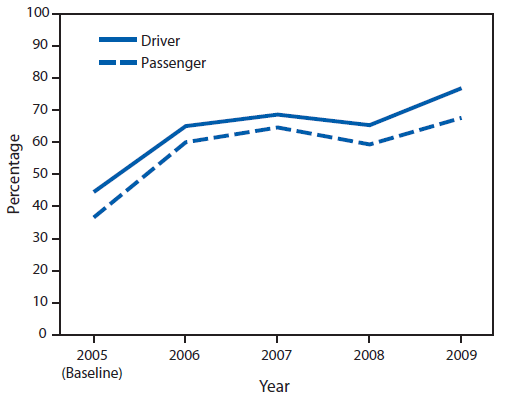
Alternate Text: The figure is a line graph that presents the percentage of observed use of seat belts among drivers and passengers from 2005 to 2009 among residents of the Tohona O'odham reservation in Arizona.
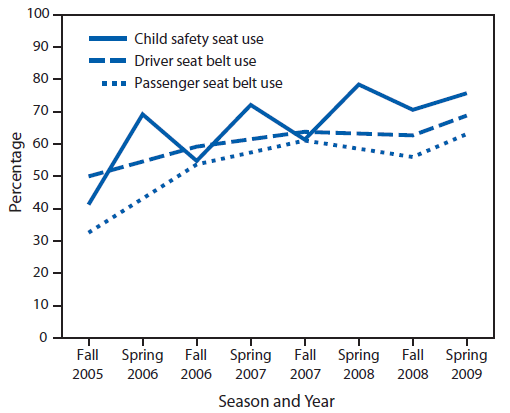
Alternate Text: The figure is a line graph that presents the percentage of seat belt use among drivers and passengers and child safety seat use from the fall of 2005 to the spring of 2009 among residents of the Ho-Chunk Nation reservation in Wisconsin.
FIGURE 5. Percentage of observed driver and passenger seat belt use — White Mountain Apache Tribe, 2002–2008
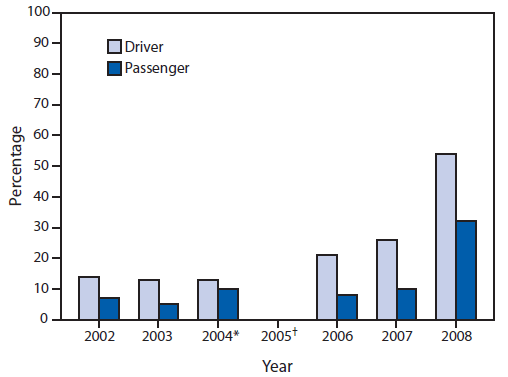
* Data from 2004 were used as baseline estimates.
† Data were unavailable for 2005.
Alternate Text: The figure is a line graph that presents the percentage of observed use of seat belts among drivers and passengers from 2002 to 2008 among residents of the White Mountain Apache Tribe reservation in Arizona.
FIGURE 6. Number of motor vehicle crashes (MVCs), by type of crash — San Carlos Apache Tribe, 2004–2008
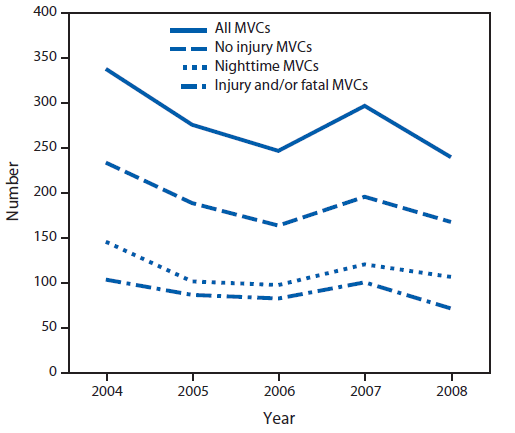
Alternate Text: The figure is a line graph that presents the number of motor vehicle crashes, by type of crash, from 2004 to 2008 among residents of the San Carlos Apache Tribe reservation in Arizona.
Use of trade names and commercial sources is for identification only and does not imply endorsement by the U.S. Department of
Health and Human Services.
References to non-CDC sites on the Internet are
provided as a service to MMWR readers and do not constitute or imply
endorsement of these organizations or their programs by CDC or the U.S.
Department of Health and Human Services. CDC is not responsible for the content
of pages found at these sites. URL addresses listed in MMWR were current as of
the date of publication.
All MMWR HTML versions of articles are electronic conversions from typeset documents.
This conversion might result in character translation or format errors in the HTML version.
Users are referred to the electronic PDF version (http://www.cdc.gov/mmwr)
and/or the original MMWR paper copy for printable versions of official text, figures, and tables.
An original paper copy of this issue can be obtained from the Superintendent of Documents, U.S.
Government Printing Office (GPO), Washington, DC 20402-9371;
telephone: (202) 512-1800. Contact GPO for current prices.
**Questions or messages regarding errors in formatting should be addressed to
mmwrq@cdc.gov.
 ShareCompartir


