Success Stories - Supporting Epidemiologic Studies
California - Preventing Exposures to Nitrates in Drinking Water NEW
![]()
What is the problem?
Nitrate-contaminated drinking water can lead to serious illness in infants. Also, exposure to nitrates has been associated with certain cancers and adverse reproductive outcomes, including various birth defects. In California, some communities are at higher risk for having nitrate contamination in their drinking water. Because there was no statewide digital map of the areas served by drinking water systems, identifying communities at higher risk for nitrate exposure has been difficult. Moreover, the state had no central location for gathering this information.
What did Tracking do?
The California Tracking Program created a Web-based tool to help water systems create digital maps of the areas they serve. Prior to this effort, many systems only had paper maps. The tracking program's water tool has received information for public water systems that serve almost 90% of the state's total population. With this information, users can also identify communities that may be using unregulated private wells, which are also at high risk for nitrate contamination.
Improved public health
The University of California at Davis, on behalf of the state Water Resources Control Board, used data from the water tool and other sources in a report to the state legislature. The report identified communities most exposed to nitrate contamination in drinking water and proposed potential remediation solutions. Findings and recommendations in the report have led to prevention, monitoring, training, and funding activities in high risk areas.
California - Identifying Exposures to Air Pollution from Traffic NEW
![]()
What is the problem?
Air pollution from traffic is associated with a variety of health problems. Researchers and public health workers use data on traffic to estimate air pollution and to look at the relationship between traffic pollution and health. However, traffic data can be difficult to access and use.
What did Tracking do?
The California Tracking Program developed a traffic tool to make it easier to access and use CalTrans traffic data for public health activities. People can use the tool to calculate a range of traffic features, such as the average number of vehicles traveling near a location per day. Users of the tool can find out how much traffic passes through any geography, such as a zip code, neighborhood, or another custom area around a specific address. Researchers can compare data from the traffic tool with health data from the CA Tracking Network or other sources to understand better the possible links between air pollution and health.
Improved public health
Several agencies have used the traffic tool to protect and improve public health. For example, the Bay Area Air Quality Management District uses the traffic tool to determine if a proposed project will increase risks of exposure to traffic pollutants. And the CA Environmental Protection Agency used the traffic tool to identify locations more likely to be exposed to pollution from traffic. The agency added this information to its screening tool which identifies communities likely to be affected most by environmental exposures and poor health.
Colorado - Evaluating radon exposure
What is the problem?
Colorado has high levels of radon in the soil. A U.S. Environmental Protection Agency (EPA) model of predicted indoor air radon levels indicates 52 of the 64 counties in Colorado are likely to exceed 4 picocuries per liter (pCi/L). This is the level at which EPA recommends action. (http://www.epa.gov/radon/zonemap.html). Voluntary radon test results had not been compiled by county—resources have not been available. So Colorado had no data to compare with the EPA model predictions. Also, little was known about peoples' awareness of the need for testing, understanding of test results, or actions taken based on radon test results.
What did Tracking do?
The tracking program worked with the Colorado Department of Public Health and Environment Radon Program to assess more than 85,000 radon test results. These results were voluntarily collected and reported to the Colorado Department of Public Health and Environment from 2005 to 2009. The tracking program also compiled and analyzed data from the 2009 Behavioral Risk Factor Surveillance System survey. This survey gathered information on what Colorado residents report about radon risk in their homes. The Colorado Tracking Network will include a radon topic page featuring this information. Maps and tables will help visualize the data.
Improved public health
The information and data on the tracking Web site will be a resource for public health and environmental practitioners and the public. It will help guide intervention strategies and encourage Colorado residents to test for radon in their homes. Testing provides residents with information about indoor air radon levels. This addition to the Colorado Department of Public Health and Environment's radon dataset will help to better understand radon levels in the state.
Connecticut - Tracking the relationship between bladder cancer and environmental contamination
What is the problem?
An industrial town in southeast Connecticut reported increased numbers of cancer cases among residents. This led to an extensive environmental study of a former manufacturing site in the town. The study looked at the relationships among lead, asbestos, and polychlorinated biphenyl contamination and a possible increase in cancer cases.
What did Tracking do?
The Connecticut Tracking Program assisted with a follow-up study to the original investigation. The follow-up study looked at bladder cancer trends in the town. The tracking program guided the study design and analyzed the data. The follow-up study found that the trend of increased male bladder cancer ended in 1989. It also showed elevated bladder cancer rates for males and females from 1991 to 1996. These increases were small, but still important.
Improved public health
The study results not only benefit the residents of the specific town but also provide all Connecticut residents with a better understanding of the relationship between the environment and health.
Iowa - Linking Lead Exposure to Risk Factors
![]()
What is the problem?
Childhood exposure to lead is a concern because it can cause developmental disabilities. Iowa has elevated child blood lead levels (BLLs) above the national average. Data from the Centers for Disease Control and Prevention show that between 2003 and 2007 more than 4,700 Iowa children had blood lead levels that were 10 micrograms per deciliter (µg/dl) or higher.
What did Tracking do?
The Iowa Tracking Program will work with the state's Childhood Lead Poisoning Prevention Program to conduct a data-linkage project. The project will study the links between childhood blood lead levels and risk factors such as poverty level, race, ethnicity, and age of housing.
Improved public health
Knowing what risk factors are related to childhood lead poisoning will help the Iowa Department of Public Health and others deliver resources and interventions to the citizens who are most at risk. This will help Iowa lower the number of children with elevated blood lead levels in the state.
Iowa - Understanding the Relationships between Nitrates and Cancer
What is the problem?
Nitrate contamination of drinking water often is found in farming areas, usually from fertilizer runoff and human and animal waste. Some studies in Iowa have suggested a link between nitrate exposure and cancer.
What did Tracking do?
The Iowa Tracking Program will make private and public water supply data and cancer data available to explore possible links between nitrates in drinking water and cancer.
Improved public health
Being able to link water and cancer data may help show associations between health effects data and nitrate contamination data. Further scientific evidence will help to create nitrate management policies and public education materials.
Kansas - Decreasing cancer cluster response time
What is the problem?
Cancer is the second leading cause of death in Kansas. In 2008, 5,286 residents died from cancer, and each year an average of 12,990 new cancer cases are diagnosed. Cancer directly or indirectly affects many Kansans. KDHE receives an average of eight inquiries about potential cancer clusters each year. Each intensive investigation requires weeks to months to complete.
What did Tracking do?
The Kansas Tracking Program will partner with the Kansas Cancer Registry to develop methods that use tracking data to decrease the time needed to respond to cancer cluster inquires. The program will also create maps and other tools to enhance communication to stakeholders.
Improved public health
The cancer data provided on the Kansas Tracking Network, along with the methods developed with the Kansas Cancer Registry, will increase the ability of public health professionals to investigate potential links between chronic diseases, such as cancer, and potential environmental health hazards.
Louisiana - Addressing concerns from imported drywall
What is the problem?
After Hurricane Katrina, rebuilding throughout the Gulf states greatly increased the demand for drywall. In February 2009, the state health department began getting health complaints from residents who had rebuilt their homes using imported drywall. The health complaints included headaches, respiratory infections, eye irritations, dry coughs, and nosebleeds.
What did Tracking do?
The Louisiana Tracking Program began logging cases from call-in surveys that captured information such as the physical characteristics of the home, exposure duration, and health effects experienced by members of the household. The cases were mapped to assess the magnitude of the health problem and to track locations. State health department staff worked with the U.S. Environmental Protection Agency to identify drywall exposure cases for indoor air testing.
Improved public health
Air monitoring results helped staff identify the chemicals of most concern and develop a public health plan of action. Public health messages provided residents information and ideas on how to reduce exposure and remove tainted drywall from their homes.
Louisiana - Educating private well water users about contamination
What is the problem?
Louisiana has a large number of residential water wells located within one mile of either an operating or abandoned wood preservation or wood treatment facility. No Louisiana law requires private well water testing. This limits the ability to assess potential exposures to chemicals through well water.
What did Tracking do?
In partnership with the Louisiana Department of Environmental Quality and the state's Safe Drinking Water Program, the Louisiana Tracking staff conducted a pilot project to link environmental, exposure, and health outcome data around wood preservation and treatment sites. The pilot project included:
- Compiling groundwater and drinking water data from areas near 22 inactive wood preservation and treatment facilities.
- Compiling data on bladder, lung, and all-sites cancers in areas surrounding wood preservation facilities.
- Establishing the Private Well Water Education Initiative to register private wells.
Improved public health
As a result of the pilot project, many residents who have private water wells contacted the health department to obtain a list of places where they can test their well water. This should help reduce potential exposures to contaminated well water.
Maryland - Answering community concerns about cancer
What is the problem?
Community concerns about cancer and potential links to environmental hazards occur relatively frequently in Maryland. Before the Maryland Tracking Program began in 2002, most concerns about cancer and the environment were addressed only by the Maryland Cancer Registry and possibly local health departments. Maryland had no systematic way to respond to frequently asked questions from individuals, groups, and communities about cancer and the environment.
What did Tracking do?
The Tracking Program, working with the Maryland Cancer Registry, geocoded all residential addresses in the Registry. Now the Maryland Cancer Registry can accurately show cancer data in maps and carry out geospatial analyses of cancer information. Also, for the first time, there is an established process for evaluation of cancer concerns in Maryland. The new process involves a coordinated response that includes the Maryland Cancer Registry, the Center for Environmental Health Coordination, the Maryland Department of the Environment (MDE), and local health departments and is now available on the Tracking Program's Web site.
Improved public health
The Tracking Program has worked with the Maryland Cancer Registry on two major cancer investigations, one in Poolesville and another in Frederick. The first looked at concerns about cancer and drinking water; the second involved concerns about cancer in a community. In both cases, the Maryland Tracking Program provided maps showing the geographic distribution of cancer and geo-statistical analyses of the cancer cases. The results of these two investigations were presented at community meetings. To date, there is no evidence of cancer clusters, but experts were able to answer questions from community residents.
Massachusetts - Investigating Parents' Concerns about Childhood Cancer NEW
What is the problem?
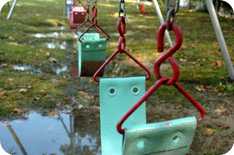
In Winchester, MA, unusually heavy rains can cause the Aberjona River to rise several feet. The river water spills over onto the ball field and playground areas of Ginn Field, a neighborhood park, and leaves behind sediment. Residents worried the sediment might contaminate the surface soil in the park. They also had concerns about herbicide applications on the field. Because of these issues, parents feared that their children might get cancer from playing in the park.
What did Tracking do?
At the request of concerned residents and the Winchester Board of Health, Massachusetts Tracking staff investigated parents' concerns about childhood cancer. They used cancer data from the state tracking network to evaluate the pattern of cancer in children. Tracking staff also investigated herbicide use and contaminants in the river water and sediment to determine what children using the field might be exposed to.
Improved public health
In January 2012, the state health department shared its findings in a report to the community and the Board of Health. The report showed that the number of new cases of childhood cancers for Winchester was similar to state trends. This information helped reassure Winchester parents and the Board of Health that touching or unintentionally eating small amounts of soil at Ginn Field would not be expected to make people sick. In addition, the Town of Winchester and the state have begun work to deepen the channel in this section of the Aberjona River as part of a series of projects to lessen the effects of flooding in the area.
Massachusetts - Collaborating with federal agencies to improve public health
![]()
What is the problem?
The U.S. Environmental Protection Agency (USEPA) asked the Massachusetts Tracking Program to evaluate lead levels in surface soil at the former Agawam Sportsman Club site. EPA wanted to find out whether the amount of lead in the soil posed a risk to young children or to others who used the area.
High amounts of lead in surface soil can pose serious health concerns if exposures occur, especially to young children.
What did Tracking do?
The Massachusetts Tracking Program evaluated surface soil sampling results for the site. The tracking program also looked at available data on blood lead levels (BLLs) in children who lived or had lived near the site.
Lead was detected in the soil in amounts higher than EPA screening levels. But, the actual BLLs among the tested children were low. The tracking program also found that the number of cases of high BLLs in the area of the former sportsmen's club was similar to other parts of the town.
Improved public health
Though BLLs among children living near the site were not as high as expected, the EPA took action to reduce possible contact with the contaminated soil.
Specifically, the EPA removed soil where needed and installed soil-erosion control devices next to a nearby stream.
New Mexico - Uranium unknowns: Making connections and directing health action
![]()
What is the problem?
The Grants Mineral Belt is high in uranium deposits. People living in this area are likely exposed to uranium in many ways from many sources. This raised concerns about the health of Grants Mineral Belt residents.
What did Tracking do?
The New Mexico Tracking Program looked at drinking water and urine sample test results The tests measured amounts of uranium in the samples. The tracking program used the data to identify Grants Mineral Belt area residents whose drinking water was likely to expose them to uranium. The tracking program also developed resources to teach residents about uranium exposure.
Improved public health
The data collected and analyzed by state tracking staffers helped public health officials and citizens learn more about uranium exposure. Now public health officials are advising of ways to reduce potential uranium exposures.
The tracking program brought together national, state, and local health agencies and partners. The tracking program collected ideas and data from all of them and make it widely available. In this way the tracking program assisted in educating Grants Mineral Belt residents about uranium exposures.
New York - Answering Concerns about Neighborhood Air Quality NEW

What is the problem?
The Buffalo Peace Bridge Plaza spans the Niagara River and connects New York State to Ontario, Canada. Lots of traffic passes over the bridge every day. Residents in neighborhoods on the New York side of the bridge worried that the planned future expansion and improvements of the Peace Bridge Plaza would cause an increase in air pollution from additional traffic and lead to respiratory health problems like asthma attacks.
What did Tracking do?
The New York State Tracking Program partnered with state environmental and transportation agencies to investigate residents' concerns. They examined air quality and related health concerns in neighborhoods surrounding the Peace Bridge toll plaza. The tracking program analyzed zip code level data on asthma-related hospital stays and emergency department visits in the neighborhoods surrounding the Peace Bridge. They also studied and mapped air quality data, traffic counts, and socioeconomic data for the same areas. The data showed that neighborhoods surrounding the bridge were not at increased risk for asthma-related health problems from air pollution.
Improved public health
The state tracking program and partners presented the information to concerned residents and issued a report. They shared information about how current air quality in the neighborhoods around the bridge was not contributing to asthma problems among people living there. Also, they educated neighborhood residents about how the new construction would result in improved air quality over time, despite a possible increase in traffic.
New York - Assisting with public health investigations
![]()
What is the problem?
A citizen asked the health department to look into respiratory disease in communities near an upstate New York coal-fired power plant. Getting, processing, and evaluating the necessary data can take a long time. Community members often want this information quickly.
What did Tracking do?
Using data gathered through the state Tracking Program, the health department quickly was able to find the rates of hospital stays for asthma and other respiratory diseases in areas downwind of the power plant. The results showed fewer than expected hospital stays for asthma, bronchitis, and chronic obstructive pulmonary disease.
Improved public health
The Tracking Program data on respiratory-related hospital stays were readily available. The health department investigated respiratory disease in the area and efficiently and quickly provided findings to local residents and to the media.
New York City - Making restaurants safer
![]()
What is the problem?
Foodborne illness is a common, costly—yet preventable—public health problem across the United States. The New York City (NYC) Tracking program estimated that foodborne illnesses in the city are responsible for
- about 7,000 hospital stays each year,
- about 20,000 emergency department visits each year, and
- thousands of cases of diarrhea every day.
Approximately half of all foodborne outbreaks reported to CDC can be linked to restaurants. In NYC, more than half of all foodborne outbreaks are restaurant related.
What did Tracking do?
NYC's Tracking Program shared this information with the NYC Board of Health. The Board of Health used the data to revise the health code to require that all restaurants post letter grades of A, B, or C in public view. The letter grades show how well or poorly a restaurant was rated during sanitary inspections. The goal of this new rule is to provide diners with easy-to-read information about the safety of their food and to motivate restaurants to maintain good food-safety practices.
Improved public health
Now NYC diners can make informed decisions about which restaurants to choose. A survey conducted in July 2011, and repeated in February 2012, showed that 90% of all New Yorkers approve of grade posting and most of them consider grades when deciding where to eat. The inspection grading system was designed to encourage restaurants to improve their food-safety practices rapidly. If a restaurant does not receive an A on its initial inspection, the Health Department conducts a surprise second inspection about a month later. The tracking program evaluated this approach and found that restaurants greatly improved their food-safety practices between the first and second inspections. Preliminary reports also suggest that reported Salmonella cases in NYC are down.
Utah - Addressing a cancer cluster concern
![]()
What is the problem?
A cancer cluster disease specialist (epidemiologist) with Utah's Tracking Program received an inquiry from a concerned resident about a possible cancer cluster in her neighborhood. The resident requested a study of the rate of female thyroid cancer in the past ten years in Tooele County. She named the Energy Solutions landfill as a possible source of environmental radiation exposure.
What did Tracking do?
The cancer cluster epidemiologist compared rates of thyroid cancer in the area to statewide rates, over five year periods. The epidemiologist used the secure Utah Tracking Network's data as well as the Rapid Inquiry Facility (RIF), a mapping and analysis tool used by the Tracking Program.
Improved public health
The epidemiologist analyzed the data from the tracking program and did not find enough evidence to prove that a thyroid cancer cluster exists among women ages 20-54 in Wasatch, Tooele, and Box Elder counties. Utah's Tracking Network helped the epidemiologist provide a much quicker response to citizens' concerns than was previously possible.
Vermont - Tracking fluoride in drinking water
![]()
What is the problem?
In Vermont, most people use drinking water from public systems that contain fluoride. Fluoride also occurs naturally in some areas of the state at levels below, equal to or higher than the safe levels set by the U.S. Environmental Protection Agency. Studies have consistently shown that water with fluoride helps to prevent tooth decay. However, some communities question the need for fluoride in their water systems.
What did Tracking do?
The Vermont Tracking Program will study insurance claims made for dental cavities, and compare those claims in towns served by public water systems with fluoride and towns with systems that do not have fluoride in the water. Data from private drinking wells will also be considered.
Improved public health
The Vermont Tracking Program plans to use the results of this project to make recommendations to local water systems about using fluoride in public drinking water systems.
- Links to non-federal organizations are provided solely as a service to our users. These links do not constitute an endorsement of these organizations or their programs by CDC or the federal government, and none should be inferred. CDC is not responsible for the content of the individual organization Web pages found at these links.
- Page last reviewed: January 3, 2014
- Page last updated: June 24, 2013
- Content source:


 ShareCompartir