Prevalence of Uncontrolled Risk Factors for Cardiovascular Disease: United States, 1999–2010
NCHS Data Brief No. 103, August 2012
On This Page
- Key findings
- Did the percentage of adults who have at least one of three CVD risk factors change from 1999 through 2010?
- During 1999–2010, did the trends in the percentage of adults who have at least one of three CVD risk factors vary by race and ethnicity?
- During 1999–2010, did the trends in the percentage of adults who have at least one of three CVD risk factors vary by income?
- What are the changes over time for each of the three CVD risk factors separately?
- Summary
- Definitions
- Data source and methods
- About the authors
- References
- Suggested citation
PDF Version (495 KB)
Cheryl D. Fryar, M.S.P.H.; Te-Ching Chen, Ph.D.; and Xianfen Li, M.S.
Key findings
Data from the National Health and Nutrition Examination Survey
- In 2009–2010, about 47% of adults had at least one of three risk factors for cardiovascular disease—uncontrolled high blood pressure, uncontrolled high levels of low-density lipoproteins (LDL) cholesterol, or current smoking.
- Men were more likely than women to have at least one of the three cardiovascular disease risk factors.
- From 1999–2000 through 2009–2010, a decrease was observed in the percentage of non-Hispanic white and Mexican-American adults who had at least one of the three risk factors for cardiovascular disease. However, this decrease was not found among non-Hispanic black adults.
- The prevalence of uncontrolled high blood pressure and of uncontrolled high LDL cholesterol declined between 1999–2000 and 2009–2010, but no significant change occurred in the percentage of adults who smoke cigarettes.
Heart disease is the leading cause of death in the United States (1). High blood pressure, high cholesterol, and smoking are all risk factors that could lead to cardiovascular disease (CVD) and stroke. The recently announced Million Hearts Initiative is aimed at preventing 1 million heart attacks and strokes over the next 5 years (2–4). This report expands on results previously published (2) by presenting the most recent prevalence estimates and trends of uncontrolled high blood pressure, uncontrolled high levels of low-density lipoproteins cholesterol (LDL-C), and current cigarette smoking among adults aged 20 and over.
Keywords: uncontrolled high blood pressure, uncontrolled high cholesterol, smoking, National Health and Nutrition Examination Survey
Did the percentage of adults who have at least one of three CVD risk factors change from 1999 through 2010?
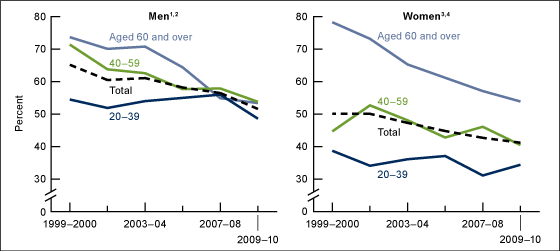
During 1999–2010, a decreasing trend was observed in the percentage of adults with at least one of three risk factors for CVD, from 57.8% (about 109 million adults) in 1999–2000 to 46.5% (about 102.5 million adults) in 2009–2010 (data not shown). This decreasing trend was found among both men and women (Figure 1). Among men, this decrease occurred in age groups 40–59 and 60 and over. For women, the decreasing trend was found only among those aged 60 and over, from 78.3% in 1999–2000 to 53.9% in 2009–2010.
In 2009–2010, men (51.6%) were more likely than women (41.2%) to have at least one of the three risk factors for CVD. Having at least one of three CVD risk factors did not significantly differ by age group among men. Women aged 60 and over (53.9%) were more likely to have at least one of the three CVD risk factors compared with women aged 40–59 (40.5%) or 20–39 (34.4%).
Figure 1. Age-adjusted percentage of adults aged 20 and over who have uncontrolled high blood pressure or uncontrolled high LDL cholesterol, or who currently smoke, by sex and age: United States, 1999–2010
1Significant decreasing linear trend for age groups 40–59 and 60 and over (p < 0.05).
2In 2009–2010, significantly different from women.
3Significant decreasing linear trend for age group 60 and over (p < 0.05).
4In 2009–2010, women aged 60 and over significantly different from women aged 40–59 and 20–39.
NOTES: Data include participants examined as part of the morning fasting subsample only and exclude pregnant women. Data are age-adjusted to year 2000 U.S. Census Bureau estimates using age groups 20–39, 40–59, and 60 and over. LDL is low-density lipoproteins.
SOURCE: CDC/NCHS, National Health and Nutrition Examination Survey, 1999–2010.
During 1999–2010, did the trends in the percentage of adults who have at least one of three CVD risk factors vary by race and ethnicity?
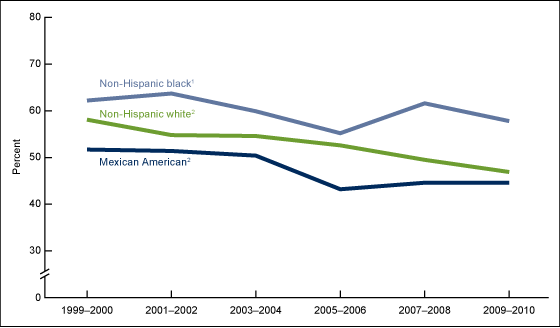
From 1999–2000 through 2009–2010, a significant decrease was observed in the percentages of non-Hispanic white and Mexican-American adults with at least one of the three risk factors for CVD (Figure 2). However, a significant decrease was not found among non-Hispanic black adults. Over the 12-year period, the percentage of non-Hispanic black persons with one of three CVD risk factors was higher than the percentages of non-Hispanic white or Mexican-American persons. In 2009–2010, almost 58% of non-Hispanic black adults had at least one risk factor, while about 47% of non-Hispanic white adults and almost 45% of Mexican-American adults had at least one of the three risk factors for CVD.
Figure 2. Age-adjusted percentage of adults aged 20 and over who have uncontrolled high blood pressure or uncontrolled high LDL cholesterol, or who currently smoke, by race and ethnicity: United States, 1999–2010
1In 2009–2010, significantly different from non-Hispanic white and Mexican American.
2Significant decreasing linear trend (p < 0.05).
NOTES: Data include participants examined as part of the morning fasting subsample only and exclude pregnant women. Data are age-adjusted to year 2000 U.S. Census Bureau estimates using age groups 20–39, 40–59, and 60 and over. LDL is low-density lipoproteins.
SOURCE: CDC/NCHS, National Health and Nutrition Examination Survey, 1999–2010.
During 1999–2010, did the trends in the percentage of adults who have at least one of three CVD risk factors vary by income?
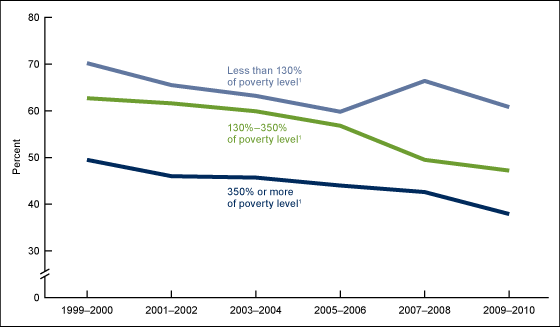
From 1999–2000 through 2009–2010, the percentage of adults with at least one of the three CVD risk factors decreased in all income groups (Figure 3). Over this 12-year period, the percentage of adults in the lowest income group with at least one of three CVD risk factors was higher than the percentages in the other income groups. In 2009–2010, lower-income adults were more likely to have at least one of the three CVD risk factors (60.8%) compared with those in the middle-income (47.2%) and higher-income (37.9%) groups. Middle-income adults were more likely to have at least one of three risk factors for CVD compared with higher-income adults.
Figure 3. Age-adjusted percentage of adults aged 20 and over who have uncontrolled high blood pressure or uncontrolled high LDL cholesterol, or who currently smoke, by income: United States, 1999–2010
1Significant decreasing linear trend (p < 0.05), and in 2009–2010, all income groups significantly different.
NOTES: Data include participants examined as part of the morning fasting subsample only and exclude pregnant women. Data are age-adjusted to year 2000 U.S. Census Bureau estimates using age groups 20–39, 40–59, and 60 and over. LDL is low-density lipoproteins.
SOURCE: CDC/NCHS, National Health and Nutrition Examination Survey, 1999–2010.
What are the changes over time for each of the three CVD risk factors separately?
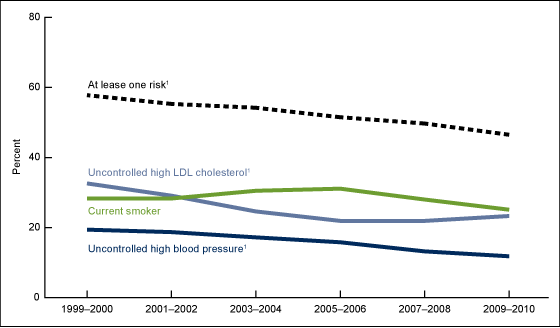
Among U.S. adults, the prevalence of both uncontrolled high blood pressure and uncontrolled high levels of LDL-C declined between 1999–2000 and 2009–2010 (declines of 7.6 percentage points for uncontrolled high blood pressure and 9.3 percentage points for uncontrolled high LDL-C) (Figure 4). Over the 12-year period, smoking prevalence did not decrease significantly. In 2009–2010, among adults aged 20 and over, 25.1% of adults were current smokers, 23.3% had uncontrolled high LDL-C, and 11.8% had uncontrolled high blood pressure.
Figure 4. Age-adjusted percentage of uncontrolled high blood pressure, uncontrolled high LDL cholesterol, and current smoking among adults aged 20 and over: United States, 1999–2010
1Significant decreasing linear trend (p < 0.05).
NOTES: Data include participants examined as part of the morning fasting subsample only and exclude pregnant women. Data are age-adjusted to year 2000 U.S. Census Bureau estimates using age groups 20–39, 40–59, and 60 and over. LDL is low-density lipoproteins.
SOURCE: CDC/NCHS, National Health and Nutrition Examination Survey, 1999–2010.
Summary
In 2009–2010, approximately 46.5% of U.S. adults aged 20 and over had at least one of three risk factors for CVD and stroke. More than one-quarter were current smokers, more than 23% had uncontrolled high levels of LDL-C, and almost 12% had uncontrolled high blood pressure. Adults who were male, or female aged 60 and over, or non-Hispanic black, or of lower income were more likely to have one of the risk factors for CVD compared with their counterparts.
Over the 12-year period from 1999 through 2010, the percentage of adults aged 20 and over with uncontrolled high blood pressure or uncontrolled high levels of LDL-C declined. During the same time period, the percentage of adults who smoked cigarettes did not decrease significantly.
These findings may provide useful information for monitoring the U.S. adult population for risk factors that could lead to CVD.
Definitions
Uncontrolled high blood pressure: A measured systolic blood pressure of 140 mm Hg or more, or a diastolic blood pressure of 90 mm Hg or more (5), based on an average of up to three measurements. Persons defined as having uncontrolled high blood pressure may or may not have been taking medication.
Uncontrolled high LDL cholesterol (LDL-C): Measured levels of LDL-C above the treatment goals established by the National Cholesterol Education Program's Adult Treatment Panel III guidelines: less than 160 mg/dL for low-risk groups, less than 130 mg/dL for intermediate-risk groups, and less than 100 mg/dL for high-risk groups (6). Persons defined as having uncontrolled high LDL-C may or may not have been taking medication.
Smoker: Defined as "current smoker" if the survey participant reported that he or she smoked at least 100 cigarettes in his or her lifetime and now smokes every day or some days, or based on a measured serum cotinine (the primary nicotine metabolite) level greater than 10 ng/mL.
Poverty income ratio: An index representing the ratio of family income to poverty level. The U.S. Department of Health and Human Services' poverty guidelines were the measure used to calculate this index (7). The cut point for participation in the Supplemental Nutrition Assistance Program is 130% of the poverty level.
Data source and methods
Data from the National Health and Nutrition Examination Survey (NHANES) were used for these analyses. NHANES is a cross-sectional survey designed to monitor the health and nutritional status of the civilian, noninstitutionalized U.S. population (8). The survey consists of interviews conducted in participants' homes, standardized physical examinations conducted in mobile examination centers, and laboratory tests utilizing blood and urine specimens provided by participants during the physical examination. LDL-C was calculated for a subsample of participants who fasted and were examined in the morning.
The NHANES sample is selected through a complex, multistage design that includes selection of primary sampling units (counties), household segments within the counties, and, finally, sample persons from selected households. The sample design includes oversampling to obtain reliable estimates of health and nutritional measures for population subgroups. African-American persons, Mexican-American persons, those having low income, and persons aged 60 and over were oversampled during 1999–2010. Beginning in 2007, all Hispanic persons, rather than only Mexican-American persons, were oversampled. However, sampling fractions were set so that the sample size for Mexican-American participants would not be very different from previous years and would be sufficient to produce reliable estimates for this group (9). NHANES public-use data files are released in 2-year cycles.
Persons with missing blood pressure or LDL-C measurements were excluded from this analysis (none were missing smoking status). Because serum LDL-C levels were derived for participants who were examined in the morning session only, fasting subsample weights—which account for the differential probabilities of selection, nonresponse, and noncoverage—were incorporated into the estimation process. The standard errors of the percentages were estimated using Taylor series linearization, a method that incorporates the sample design (10).
Estimates for the total population were age adjusted to the year 2000 projected U.S. standard population using three age groups: 20–39, 40–59, and 60 and over. Differences between groups were evaluated using a t statistic at the p < 0.05 significance level with the appropriate degrees of freedom. All differences reported are statistically significant unless otherwise indicated. To test for linear trends, the null hypothesis of nonlinear trend was examined using orthogonal polynomials. Statistical analyses were conducted using SAS for Windows, release 9.2 (SAS Institute, Cary, N.C.), and SUDAAN release 10.0 (RTI International, Research Triangle Park, N.C.).
About the authors
Cheryl D. Fryar is with the Centers for Disease Control and Prevention's National Center for Health Statistics (NCHS), Division of Health and Nutrition Examination Surveys. Te-Ching Chen and Xianfen Li are with the Harris Corporation under a contract with NCHS.
References
- Miniño AM. Death in the United States, 2009. NCHS data brief, no 64. Hyattsville, MD: National Center for Health Statistics. 2011.
- CDC. Million Hearts: Strategies to reduce the prevalence of leading cardiovascular disease risk factors—United States, 2011. MMWR 60(36):1248–51. 2011.
- Tomaselli GF, Harty MB, Horton K, Schoeberl M. The American Heart Association and the Million Hearts Initiative: A presidential advisory from the American Heart Association. Circulation 124(16):1795–9. 2011.
- Frieden TR, Berwick DM. The "Million Hearts" Initiative—Preventing heart attacks and strokes. N Engl J Med 365(13):e27. 2011.
- Chobanian AV, Bakris GL, Black HR, Cushman WC, Green LA, Izzo JL Jr, et al. The seventh report of the Joint National Committee on Prevention, Detection, Evaluation, and Treatment of High Blood Pressure. Hypertension 42(6):1206–52. 2003.
- National Institutes of Health. Third report of the National Cholesterol Education Program (NCEP) Expert Panel on Detection, Evaluation, and Treatment of High Blood Cholesterol in Adults (Adult Treatment Panel III). NIH 02–5215. Washington, DC. 2002.
- U.S. Department of Health and Human Services, Assistant Secretary for Planning and Evaluation. Poverty guidelines, research, and measurement. Washington, DC. 2011.
- National Center for Health Statistics. National Health and Nutrition Examination Surveys 1999–2010.
- National Center for Health Statistics. Analytic note regarding 2007–2010 survey design changes and combining data across other survey cycles [PDF 19KB]. Hyattsville, MD. [Accessed July 23, 2012].
- National Center for Health Statistics. The National Health and Nutrition Examination Survey (NHANES) analytic and reporting guidelines. [Accessed July 23, 2012].
Suggested citation
Fryar CD, Chen T, Li X. Prevalence of uncontrolled risk factors for cardiovascular disease: United States, 1999–2010. NCHS data brief, no 103. Hyattsville, MD: National Center for Health Statistics. 2012.
Copyright information
All material appearing in this report is in the public domain and may be reproduced or copied without permission; citation as to source, however, is appreciated.
National Center for Health Statistics
Edward J. Sondik, Ph.D., Director
Jennifer H. Madans, Ph.D., Associate Director for Science
Division of Health and Nutrition Examination Surveys
Clifford L. Johnson, M.S.P.H., Director
- Page last reviewed: November 6, 2015
- Page last updated: August 3, 2012
- Content source:


 ShareCompartir


