Trends in Long-acting Reversible Contraception Use Among U.S. Women Aged 15–44
NCHS Data Brief No. 188, February 2015
On This Page
- Key findings
- Current use of a long-acting reversible contraceptive method increased nearly five-fold in the last decade among women aged 15–44.
- In 1982 and since 2002, women aged 25–34 used long-acting reversible contraception at a higher rate compared with women aged 15–24 or 33–44.
- Patterns of use of long-acting reversible contraception varied by race and Hispanic origin over the last 30 years.
- Women who have had at least one birth use LARC methods at a higher rate than women who have had no previous births.
- Summary
- Definitions
- Data source and methods
- About the authors
- References
- Suggested citation
PDF Version (625 KB)
Amy M. Branum, M.S.P.H., Ph.D.; and Jo Jones, Ph.D.
Key findings
Data from the National Survey of Family Growth
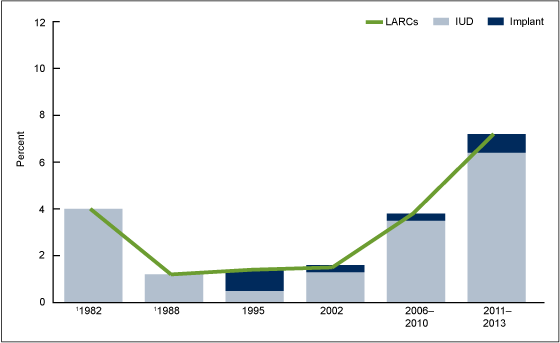
- Use of long-acting reversible contraceptives (LARCs) declined between 1982 and 1988, remained stable through 2002, and then increased nearly five-fold in the last decade among women aged 15–44, from 1.5% in 2002 to 7.2% in 2011–2013.
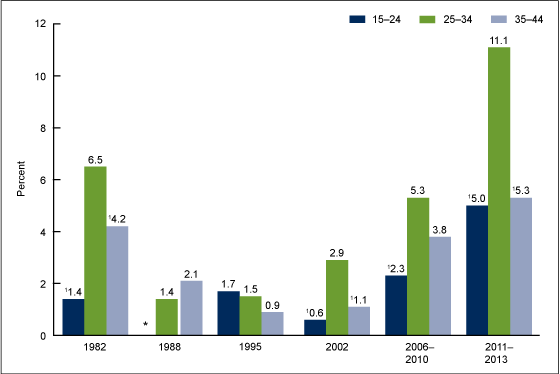
- The percentage of women using LARCs has remained highest among women aged 25–34, with more than twice as many women aged 25–34 (11.1%) using LARCs in 2011–2013 compared with women aged 15–24 (5.0%) and aged 35–44 (5.3%).
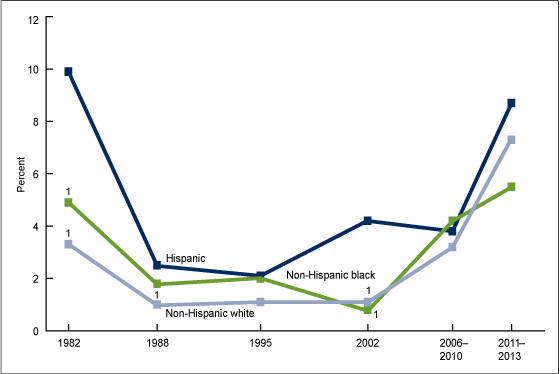
- After decreasing between 1982 and 1988 and remaining stable from 1988 through 1995, LARC-use patterns diverged among Hispanic, non-Hispanic white, and non-Hispanic black women.
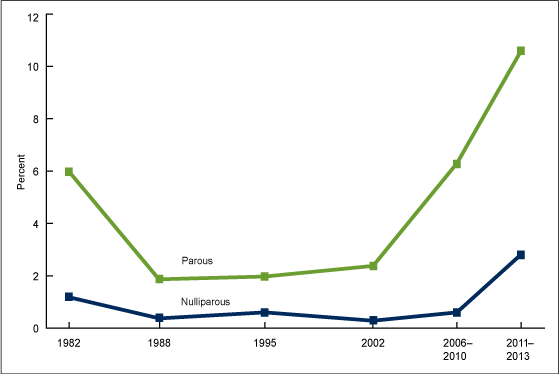
- Women who have had at least one birth use LARCs at a higher rate compared with women who have had no previous births, and this difference has increased over time.
Long-acting reversible contraceptives (LARCs), which include intrauterine devices (IUDs) and subdermal hormonal implants, are gaining popularity due to their high efficacy in preventing unintended pregnancies. IUD use was more common among U.S. women in the 1970s before concerns over safety led to a decline in use (1); however, since approval of a 5-year contraceptive implant in 1990 and redesigned IUDs, there has been growing interest in the use of LARCs for unintended pregnancy prevention. Using data from the 1982, 1988, 1995, 2002, 2006–2010, and 2011–2013 National Survey of Family Growth (NSFG), this report examines trends in current LARC use among women aged 15–44 and describes patterns of use by age, race and Hispanic origin, and parity.
Keywords: intrauterine devices, hormonal implants, National Survey of Family Growth
Figure 1. Trends in current long-acting reversible contraceptive use, by device
1Implants were not available in 1982 and 1988.
NOTES: Linear decrease from 1982 to 1988 and linear increase from 2002 to 2011–2013 for all LARCs are statistically significant; linear increase in IUD use from 1995 to 2011–2013 is statistically significant. IUD is intrauterine device; LARCs are long-acting reversible contraceptives.
SOURCE: CDC/NCHS, National Survey of Family Growth, 1982, 1988, 1995, 2002, 2006–2010, and 2011–2013.
Current use of a long-acting reversible contraceptive method increased nearly five-fold in the last decade among women aged 15–44.
- In 1982, 4.0% of women aged 15–44 reported using a LARC for their current contraceptive method; by 1988, current LARC use was reported by 1.4% of women (Figure 1).
- After no change between 1988 and 2002, current LARC use doubled between 2002 (1.5%) and 2006–2010 (3.8%) and then nearly doubled for 2011–2013 (7.2%).
- IUDs have accounted for the largest proportion of LARC usage since 2002. Comparing 2006–2010 with 2011–2013, IUD use increased 83% (from 3.5% to 6.4%), while implant use tripled (from 0.3% to 0.8%).
In 1982 and since 2002, women aged 25–34 used long-acting reversible contraception at a higher rate compared with women aged 15–24 or 33–44.
- Current LARC use was higher among women aged 25–34 compared with women aged 15–24 at all time points except 1988 and 1995. Although LARC use tended to be higher among women aged 25–34 compared with women aged 35–44, the difference was not always statistically significant (Figure 2).
- After remaining relatively unchanged from 1982 to 2002, LARC use among women aged 15–24 increased nearly four-fold between 2002 (0.6%) and 2006–2010 (2.3%) and doubled again for 2011–2013 (5.0%).
Figure 2. Trends in long-acting reversible contraceptive use, by age
1Significantly less than women aged 25–34.
* Figure does not meet standards of reliability or precision; too few women aged 15–24 reported using long-acting reversible contraceptives in 1988.
NOTE: Linear trends in use of long-acting reversible contraceptives for all age groups from 2002 to 2011–2013 are statistically significant.
SOURCE: CDC/NCHS, National Survey of Family Growth, 1982, 1988, 1995, 2002, 2006–2010, and 2011–2013.
- From 2006–2010 to 2011–2013, LARC use approximately doubled among women aged 25–34 (5.3 to 11.1%).
- After tripling between 2002 (1.1%) and 2006–2010 (3.8%), LARC use slowed among women aged 35–44, to a 34% increase from 2006–2010 to 2011–2013 (5.3%).
Patterns of use of long-acting reversible contraception varied by race and Hispanic origin over the last 30 years.
- Decreases in LARC use were similar for Hispanic, non-Hispanic white, and non-Hispanic black women from 1982 to 1988 and remained stable for each race and Hispanic origin group from 1988 to 1995. However, after 1995, patterns of use diverged (Figure 3).
- Although LARC use tripled for non-Hispanic white women and increased four-fold for non-Hispanic black women between 2002 and 2006–2010, use among Hispanic women declined 10% during this period.
- LARC use increased at a similar rate among Hispanic (129%) and non-Hispanic white (128%) women from 2006–2010 to 2011–2013, whereas non-Hispanic black women had a 30% increase in LARC use during this time.
Figure 3. Trends in long-acting reversible contraceptive use, by race and Hispanic origin
1Significantly less than Hispanic women.
NOTES: Linear trends for non-Hispanic white and non-Hispanic black women from 2002 through 2011–2013 are statistically significant.
SOURCE: CDC/NCHS, National Survey of Family Growth, 1982, 1988, 1995, 2002, 2006–2010, and 2011–2013.
Women who have had at least one birth use LARC methods at a higher rate than women who have had no previous births.
- In 1982, parous women (6.0%) used LARCs five times more often compared with nulliparous women (1.2%); during 2011–2013, rate of use was three times greater among parous (11.0%) compared with nulliparous (2.8%) women (Figure 4).
- After remaining stable between 1988 and 2006–2010, LARC use increased almost 10-fold among women with no previous births through the 2011–2013 time period.
- Among parous women, LARC use declined between 1982 and 1988 and remained stable until 2002, when it increased two and one-half times between 2002 (2.4%) and 2006–2010 (6.3%), and then increased nearly 70% from 2006–2010 to 2011–2013 (10.6%).
Figure 4. Trends in long-acting reversible contraceptive use, by parity
NOTES: Linear decrease in use of long-acting reversible contraceptives (LARCs) from 1982 to 1988 is statistically significant for parous women only. Linear increase in LARC use for both parity groups from 2002 through 2011–2013 is statistically significant. Nulliparous women had statistically significantly lower LARC use compared with parous women for each time point.
SOURCE: CDC/NCHS, National Survey of Family Growth, 1982, 1988, 1995, 2002, 2006–2010, and 2011–2013.
Summary
After declining from the early 1980s through 2002, use of long-acting reversible contraception has increased over the last decade. Women aged 25–34 and women who have already had a child continue to use LARCs at the highest rates as their current contraceptive methods; additionally, larger percent increases in LARC use have occurred more recently among young women (aged 15–24) and women who have not given birth. Although sharp increases in use occurred among non-Hispanic black women between 2002 and 2006–2010, the rate of increase has slowed through the 2011–2013 time period. LARC use more than doubled among Hispanic and non-Hispanic white women in the most recent time periods. Non-Hispanic white women, who have historically used LARCs at the lowest rate, had a rate of use similar to Hispanic women in 2011–2013.
Long-acting reversible contraception has demonstrated greater efficacy in preventing unintended pregnancy among all women compared with other contraceptive methods, including the oral contraceptive pill and the transdermal patch (2,3). In addition, recent research has demonstrated that women opt for long-acting methods as their contraceptive method of choice when informed about these options (4); however, other research has demonstrated that barriers to LARC administration and use still remain (5,6).
Definitions
Contraceptive status: This variable measures the contraceptive method used (if any) in the month of the interview. The recode variable used was CONSTAT1. In this report, women who were currently using more than one method were classified by the method that was most effective in preventing pregnancy, because that method has the greatest impact on their risk of unintended pregnancy. For example, women who reported using both LARCs and male condoms in the current month were classified as using LARCs because LARCs are more effective in preventing a pregnancy. In 2011–2013, 10.7% of women who were currently using contraception used more than one contraceptive method during the same month.
Hispanic origin and race: The Office of Management and Budget (OMB) guidelines for the presentation of race and origin data in federal statistics are used for these classifications (7). The 1997 OMB guidelines where each respondent may choose more than one race are followed, and the recode variable, HISPRACE2, is used for the 2002, 2006–2010, and 2011–2013 survey years. For the 1982, 1988, and 1995 survey years, an equivalent of HISPRACE2 was constructed by restricting the analysis to women who only reported one race. In this report, the categories Hispanic, non-Hispanic white single race, and non-Hispanic black single race are shown. Given the diversity of women categorized as non-Hispanic other single and multiple race, those results are not shown.
Data source and methods
This report is based on data from women in the female respondent files of the 1982, 1988, 1995, 2002, 2006–2010, and 2011–2013 NSFG. The data are comparable across the years included for this analysis on the key variables shown in this data brief. The 1982 survey served as the starting point, as NSFG in years prior to 1982 was conducted only among women who were currently or formerly married; therefore, the data for these years are not comparable to data in the 1982 NSFG and beyond for purposes of this analysis.
Among other information, NSFG provides detailed information about contraceptive use among U.S. women of reproductive age. NSFG is jointly planned and funded by the Centers for Disease Control and Prevention’s National Center for Health Statistics and several other programs of the U.S. Department of Health and Human Services. All estimates in this report were weighted to reflect the reproductive-aged female household population of the United States of the midpoint for each time period of the survey.
Statistics for this report were produced using the SURVEY procedures in SAS software version 9.3. Differences between percentages were evaluated using two-tailed significance tests at the 0.05 level. The significance of trends was tested using weighted least-squares regression models to determine whether an apparent change over time was statistically significant, taking into account the standard error for each data point. The data presented in this report are bivariate associations that may be explained by other factors not controlled for in the figures or included in the report.
About the authors
Amy M. Branum and Jo Jones are with CDC’s National Center for Health Statistics, Division of Vital Statistics, Reproductive Statistics Branch.
References
- Cleland K, Zhu H, Goldstuck N, Cheng L, Trussell J. The efficacy of intrauterine devices for emergency contraception: A systematic review of 35 years of experience. Hum Reprod 27(7):1994–2000. 2012.
- Winner B, Peipert JF, Zhao Q, Buckel C, Madden T, Allsworth JE, Secura GM. Effectiveness of long-acting reversible contraception. N Eng J Med 366(21):1998–2007. 2012.
- CDC. U.S. medical eligibility criteria for contraceptive use, 2010. MMWR 59(RR-4):1–86. 2010.
- Secura GM, Madden T, McNicholas C, Mullersman J, Buckel CM, Zhao Q, Peipert JF. Provision of no-cost, long-acting contraception and teenage pregnancy. N Engl J Med 371(14):1316–23. 2014.
- Park HY, Rodriguez MR, Huelett D, Darney PD, Thiel de Bocanegra H. Long-acting reversible contraception method use among Title X providers and non-Title X providers in California. Contraception 86(5):557–61. 2012.
- Beeson T, Wood S, Bruen B, Goldberg DG, Mead H, Rosenbaum S. Accessibility of long- acting reversible contraceptives (LARCs) in federally qualified health centers (FQHCs). Contraception 89(2):91–6. 2014.
-
OMB. Race and ethnic standards for federal statistics and administrative reporting. Directive no. 15. Adopted May 12, 1977.
Suggested citation
Branum AM, Jones J. Trends in long-acting reversible contraception use among U.S. women aged 15–44. NCHS data brief, no 188. Hyattsville, MD: National Center for Health Statistics. 2015.
Copyright information
All material appearing in this report is in the public domain and may be reproduced or copied without permission; citation as to source, however, is appreciated.
National Center for Health Statistics
Charles J. Rothwell, M.S., M.B.A., Director
Nathaniel Schenker, Ph.D., Deputy Director
Jennifer H. Madans, Ph.D., Associate Director for Science
Division of Vital Statistics
Delton Atkinson, M.P.H., M.P.H., P.M.P., Director
- Page last reviewed: November 6, 2015
- Page last updated: February 24, 2015
- Content source:


 ShareCompartir


