Characteristics of Physician Office Visits for Obesity by Adults Aged 20 and Over: United States, 2012
On This Page
- Key findings
- What was the obesity visit rate to physician offices for adults in 2012, and did visit rates vary by age or sex?
- Were additional chronic conditions listed at physician office visits for obesity by adults?
- How often were selected health risk factors assessed at visits for obesity compared with visits for other diagnoses by adults?
- How often was weight-related health education listed at visits for obesity compared with visits for other diagnoses by adults?
- Summary
- Definitions
- Data source and methods
- About the authors
- References
- Suggested citation
Anjali Talwalkar, M.D., M.P.H., and Frances McCarty, M.Ed., Ph.D.
Key findings
Data from the National Ambulatory Medical Care Survey, 2012
- In 2012, 11 million visits, or an annual visit rate of 49 visits per 1,000 persons, to physician offices for obesity were made by adults aged 20 and over.
- Annual visit rates for obesity varied by age and sex.
- Additional chronic conditions were listed more frequently at visits for obesity than at visits for other diagnoses.
- Visits for obesity were 25% more likely to include assessments of height and weight and of blood pressure, and more than 50% more likely to include testing of blood glucose and lipids, compared with visits for other diagnoses.
- Health education about diet and nutrition, exercise, or weight reduction was at least four times more likely to be offered at visits for obesity compared with visits for other diagnoses.
Obesity, a complex and costly condition, affects more than one-third of adults in the United States (1). It raises the risk of morbidity from chronic diseases and is a major cause of preventable death (2). Healthy People 2020 objectives for weight status include the delivery of weight-related services in health care settings (3). This report examines health care visits for obesity by adults aged 20 and over in 2012. A visit for obesity is one where the provider listed obesity as one of the diagnoses for the visit. National estimates on the assessment of risk factors and the provision of health-education services at these visits are presented.
Keywords: chronic conditions, health education, National Ambulatory Medical Care Survey
What was the obesity visit rate to physician offices for adults in 2012, and did visit rates vary by age or sex?
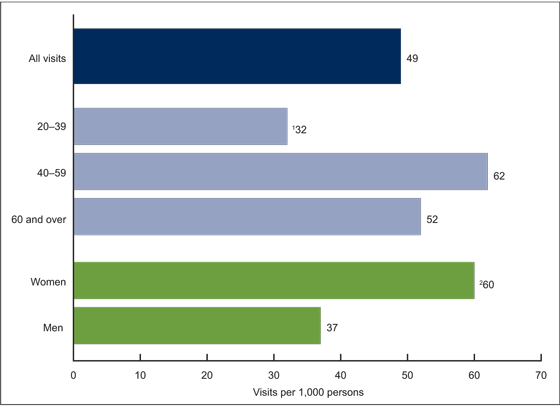
In 2012, 49 visits per 1,000 persons aged 20 and over were made to physician offices in the United States for obesity (Figure 1). This amounts to 11 million annual visits or 2% of all visits by nonpregnant, nonpostpartum adults (data not shown).
The visit rate was significantly lower for patients aged 20–39 (32 visits per 1,000) compared with older age groups. There was no difference between the visit rates of patients aged 40–59 and patients aged 60 and over.
Women had a significantly higher obesity visit rate (60 visits per 1,000) than men (37 visits).
Figure 1. Physician office visit rates for obesity, by age and sex: United States, 2012
1Significant difference between 20–39 age group and all other age groups (p < 0.05).
2Significant difference between women and men (p < 0.05).
NOTES: Visit rates are based on the U.S. Census Bureau’s July 1, 2012 estimates of the civilian noninstitutionalized population of the United States. A visit for obesity is a visit in which obesity is listed by the provider as one of up to three diagnoses for the visit.
SOURCE: CDC/NCHS, National Ambulatory Medical Care Survey, 2012.
Were additional chronic conditions listed at physician office visits for obesity by adults?
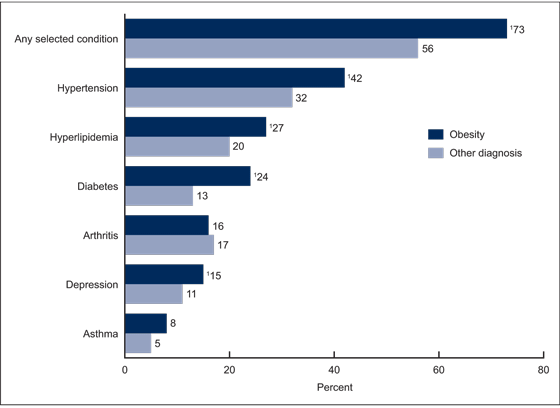
An additional chronic condition was listed at 73% of visits for obesity compared with 56% of visits for other diagnoses (Figure 2).
Hypertension, hyperlipidemia, diabetes, and depression were listed at a higher percentage of visits for obesity than at visits for other diagnoses (42% compared with 32%; 27% compared with 20%; 24% compared with 13%; and 15% compared with 11%, respectively).
Hypertension was the most commonly listed chronic condition at visits for obesity (42%).
Asthma and arthritis were not more likely to be listed at visits for obesity than at visits for other conditions.
Figure 2. Physician office visits with selected chronic conditions listed, by visit diagnosis: United States, 2012
1Difference between visits for obesity and visits for all other diagnoses is statistically significant (p < 0.05).
NOTE: A visit for obesity is a visit in which obesity is listed by the provider as one of up to three diagnoses for the visit.
SOURCE: CDC/NCHS, National Ambulatory Medical Care Survey, 2012.
How often were selected health risk factors assessed at visits for obesity compared with visits for other diagnoses by adults?
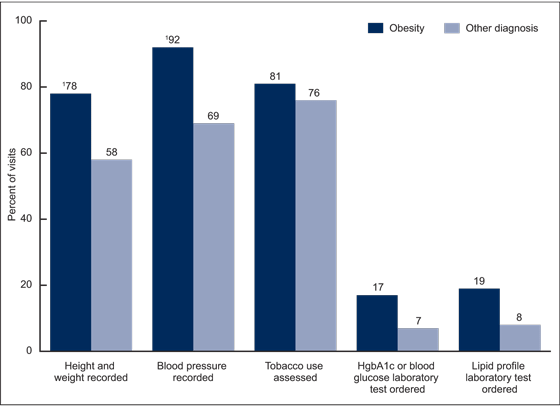
A higher percentage of visits for obesity had both height and weight recorded at the visit (78%) than visits for other diagnoses (58%) (Figure 3).
A higher percentage of visits for obesity had blood pressure recorded at the visit (92%) than visits for other diagnoses (69%).
Blood glucose or hemoglobin A1c testing and lipid profile testing were more frequently ordered at visits for obesity than at visits for other diagnoses.
There was no difference in assessment of tobacco use at visits for obesity compared with visits for other diagnoses.
Figure 3. Physician office visits with selected health risk factors assessed, by visit diagnosis: United States, 2012
1Difference between visits for obesity and visits for all other diagnoses is statistically significant (p < 0.05).
NOTE: A visit for obesity is a visit in which obesity is listed by the provider as one of up to three diagnoses for the visit.
SOURCE: CDC/NCHS, National Ambulatory Medical Care Survey, 2012
How often was weight-related health education listed at visits for obesity compared with visits for other diagnoses by adults?
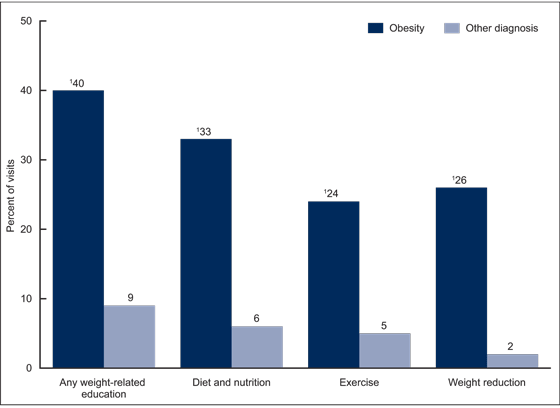
Forty percent of visits for obesity had at least one weight-related service listed compared with 9% of visits for other diagnoses (Figure 4).
Diet and nutrition education was listed at 33% of visits for obesity and at 6% of visits for other diagnoses.
Exercise education was listed at 24% of visits for obesity and at 5% of visits for other diagnoses.
Weight-reduction education was listed at 26% of visits for obesity and at 2% of visits for other diagnoses.
Figure 4. Physician office visits with weight-related health-education services listed, by visit diagnosis: United States, 2012
1Difference between visits for obesity and visits for all other diagnoses is statistically significant (p < 0.05).
NOTE: A visit for obesity is a visit in which obesity is listed by the provider as one of up to three diagnoses for the visit.
SOURCE: CDC/NCHS, National Ambulatory Medical Care Survey, 2012.
Summary
According to data from 2011 through 2012, 78.6 million adults in the United States are obese (1). This report examined visits to physician offices for obesity. The health care delivered during these visits, specifically assessment of related risk factors and health education, was significantly different from care delivered at visits for other diagnoses. Visits for obesity were more likely to include testing for blood glucose and lipids as well as assessments of height, weight, and blood pressure. Additionally, weight-related health-education services were more likely to be listed at visits for obesity compared with visits for other diagnoses. While health education is offered relatively more often at visits for obesity, overall, it is offered at less than one-half of these visits. At least one weight-related service was ordered or provided at 40% of visits for obesity. Examining office visits for obesity can help monitor and inform ongoing efforts to meet Healthy People 2020 objectives for weight status in health care settings.
Definitions
Diet and nutrition health-education services: Refers to any topics related to the foods or beverages consumed by the patient. Examples include general dietary guidelines for health promotion and disease prevention, dietary restrictions to treat or control a specific medical problem or condition, and dietary instructions related to medications. It also includes referrals to other health professionals, such as dietitians and nutritionists.
Exercise health-education services: Refers to any topics related to the patient’s physical conditioning or fitness. Examples include information aimed at general health promotion and disease prevention, and information given to treat or control a specific medical condition. It also includes referrals to other health and fitness professionals. It does not include referrals for physical therapy.
Visit for obesity: Refers to a visit in which obesity is listed by the provider as one of up to three diagnoses for the visit. All physician office visits for obesity are included across all specialties (medical, surgical, and primary care specialties).
Weight-reduction health-education services: Refers to information given to the patient to assist in the goal of weight reduction. It also includes referrals to other health professionals for the purpose of weight reduction.
Data source and methods
Data from the 2012 National Ambulatory Medical Care Survey (NAMCS) were analyzed. NAMCS is an annual, nationally representative survey of visits to nonfederal, office-based physicians, excluding the specialties of anesthesiology, radiology, and pathology. It is conducted by the Centers for Disease Control and Prevention’s (CDC) National Center for Health Statistics. The 2012 NAMCS sample design and sample size differs from previous years. In 2012, NAMCS used a stratified two-stage sample, with physicians selected in the first stage and visits in the second stage. The sample size increased fivefold to allow for state-level estimates in the 34 most populous states. A sample weight is computed for each sample visit that accounts for design stages. The survey data are inflated or weighted to produce unbiased national annual estimates of office visits (4). The unweighted physician response rate was 58.7% (59.7% weighted). The unweighted visit response rate for the 2012 survey was 39.3% (39.4% weighted).
Up to three visit diagnoses are collected for each sampled visit. The diagnoses are specified by the provider, not the patient. A visit for obesity was defined as any listed diagnosis code 278.00 or 278.01 based on the International Classification of Diseases, Ninth Edition, Clinical Modification (5). Visits for obesity include visits to any physician specialty, including medical, surgical, and primary care specialties. Visits by patients for pregnancy or postpartum-related diagnoses were excluded.
Recorded height and weight measurements at the visit were not used to calculate body mass index and determine or verify a diagnosis of obesity because of the high proportion of visits without both height and weight recorded. Height and weight data were not recorded in 44% of visit records by nonpregnant, nonpostpartum patients, and they were not recorded in 23% of records with a visit diagnosis of obesity. Therefore, using height and weight to define obesity may not produce representative national estimates about ambulatory care for obesity.
Data analyses were performed using the statistical packages SAS version 9.3 (SAS Institute, Cary, N.C.) and SUDAAN version 10.0 (RTI International, Research Triangle Park, N.C.). Differences in visit characteristics were evaluated with a two-tailed t test at the p < 0.05 significance level. All comparisons reported in the text are statistically significant unless otherwise indicated.
About the authors
Anjali Talwalkar is with the District of Columbia Department of Health. She conducted this research while with CDC’s National Center for Health Statistics (NCHS), Division of Health Care Statistics. Frances McCarty is with NCHS’ Division of Research and Methodology.
References
- Ogden CL, Carroll MD, Kit BK, Flegal KM. Prevalence of obesity among adults: United States, 2011–2012. NCHS data brief, no 131. Hyattsville, MD: National Center for Health Statistics. 2013.
- National Heart, Lung, and Blood Institute. Clinical guidelines on the identification, evaluation, and treatment of overweight and obesity in adults. National Institutes of Health, publication no. 98–4083. 1998.
- CDC. HealthyPeople 2020 topics and objectives: Nutrition and weight status.
- National Center for Health Statistics. 2012 NAMCS micro-data file documentation. 2014.
- National Center for Health Statistics. Classification of diseases, functioning, and disability. International Classification of Diseases, Ninth Revision, Clinical Modification (ICD–9–CM). 6th ed. Hyattsville, MD.
Suggested citation
Talwalkar A, McCarty F. Characteristics of physician office visits for obesity by adults aged 20 and over: United States, 2012. NCHS data brief, no 237. Hyattsville, MD: National Center for Health Statistics. 2016.
Copyright information
All materials appearing in this report is in the public domain and may be reproduced or copied without permission; citation as to source, however, is appreciated.
National Center for Health Statistics
Charles J. Rothwell, M.S., M.B.A., Director
Nathaniel Schenker, Ph.D., Deputy Director
Jennifer H. Madans, Ph.D., Associate Director for Science
Division of Health Care Statistics
Clarice Brown, M.S., Director
Alexander Strashny, Ph.D., Associate Director for Science
- Page last reviewed: March 3, 2016
- Page last updated: March 3, 2016
- Content source:


 ShareCompartir


