Racial and Gender Disparities in Suicide Among Young Adults Aged 18–24: United States, 2009–2013
by Caroline Jiang; Andreea Mitran, B.S.; Arialdi Miniño, M.P.H.; and Hanyu Ni, Ph.D., M.P.H., Division of Vital Statistics
On this Page
Suicide is an act of violence against oneself, resulting in death. Among teenagers and young adults aged 15–24, suicide was the second leading cause of death in 2013 (1). Because patterns of suicide may be different for young adults aged 18–24 than for teens aged 15–17, this NCHS Health E-Stat examines suicide rates and methods among young adults aged 18–24, by sex and race and Hispanic origin, using recent mortality data from the National Vital Statistics System (NVSS).
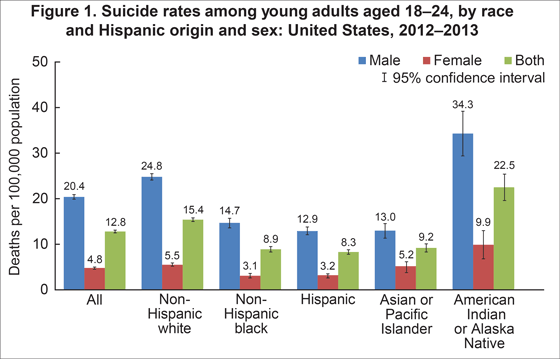
In 2012–2013, young adult males aged 18–24 were more likely than young adult females to commit suicide. This relationship was found for the five race and ethnicity groups studied (non-Hispanic white, non-Hispanic black, Hispanic, Asian or Pacific Islander [API], and American Indian or Alaska Native [AIAN]) (Figure 1). The suicide rate was highest in the AIAN population for both males and females (34.3 and 9.9 deaths per 100,000 population, respectively). AIAN males were more than twice as likely to commit suicide as most other gender and racial and ethnic subgroups. Suicide rates for AIAN young adults are likely to be underestimated; a previous study (2) found that deaths overall for the AIAN population were underreported by 30%.
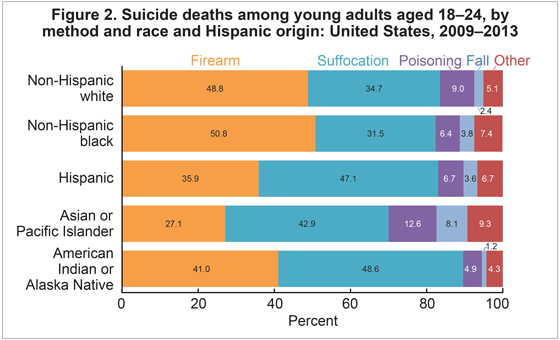
Based on combined data from 2009 through 2013 (Figure 2) for non-Hispanic black and non-Hispanic white young adults who committed suicide, firearms was the most common method used, followed by suffocation. For Hispanic, API, and AIAN young adults who committed suicide, suffocation was the most common method used, followed by firearms. Poisoning and falls were more common methods among API young adults who committed suicide (12.6% and 8.1% of suicide deaths, respectively) than among other race and ethnicity groups.
Data source and methods
Data are based on NVSS underlying cause-of-death mortality data (3). Data are from the Multiple Cause of Death files, 1999–2013, which are compiled from data provided by the 57 U.S. vital statistics jurisdictions through the Vital Statistics Cooperative Program. NVSS is a collaboration among the vital statistics reporting areas and the Centers for Disease Control and Prevention’s (CDC) National Center for Health Statistics (NCHS).
Deaths were classified using the International Statistical Classification of Diseases and Related Health Problems, Tenth Revision (ICD–10) (4). Suicide deaths were identified with ICD–10 codes U03, X60–X84, and Y87.0. Suicide deaths by falls were identified with code X80, firearms with codes X72–X74, poisoning with codes X60–X69, and suffocation with code X70.
This report uses combined data from 2012 through 2013 (Figure 1) and 2009 through 2013 (Figure 2) to obtain a sample size greater than or equal to 20 deaths, to guarantee reliable death rates. Differences in rates and percentages were tested by z test for statistical significance. The 95% confidence intervals are presented for each rate.
Values for the AIAN, API, and Hispanic-origin populations should be interpreted with caution. Deaths for the AIAN population were found to be underreported by 30%, for the API population by 7%, and for the Hispanic-origin population by 5% (for details, see “The validity of race and Hispanic origin reporting on death certificates in the United States” [2] and Technical Notes in “Deaths: Final data for 2011” [5]).
References
- Centers for Disease Control and Prevention, National Center for Injury Prevention and Control. Web-based Injury Statistics Query and Reporting System (WISQARS). 2013.
- Arias E, Schauman WS, Eschbach K, et al. The validity of race and Hispanic origin reporting on death certificates in the United States. National Center for Health Statistics. Vital Health Stat 2(148). 2008.
- National Center for Health Statistics. Underlying cause of death, 1999–2013. CDC WONDER online database. 2015.
- WHO. International statistical classification of diseases and related health problems, tenth revision (ICD–10). 2008 ed. Geneva, Switzerland. 2009.
- Kochanek KD, Murphy SL, Xu JQ. Deaths: Final data for 2011. National vital statistics reports; vol 63 no 3. Hyattsville, MD: National Center for Health Statistics. 2015.
Figures
NOTES: Suicide deaths are identified with ICD–10 codes U03, X60–X84, and Y87.0. Deaths for the American Indian or Alaska Native population may be underreported by 30%, for the Asian or Pacific Islander population by 7%, and for the Hispanic-origin population by 5%. For more details, see Technical Notes in National Vital Statistics Reports, vol. 63, no. 3, “Deaths: Final data for 2011”; also see Vital and Health Statistics, Series 2, no. 148, “The validity of race and Hispanic origin reporting on death certificates in the United States.”SOURCE: CDC/NCHS, National Vital Statistics System mortality data, 2012–2013. Available from CDC WONDER online database.

NOTES: Suicide mechanisms are identified with ICD–10 codes X80 for fall, X72–X74 for firearm, X60–X69 for poisoning, and X70 for suffocation. Other includes: Cut/Pierce; Drowning; Fire/Flame; Hot object/Substance; Machinery; Motor Vehicle Traffic; Other Pedal cyclist; Other Pedestrian; Other land transport; Other transport; Natural/Environmental; Overexertion; Struck by or against; Other specified, classifiable Injury; Other specified, not elsewhere classified Injury; and Unspecified Injury. Deaths for the American Indian or Alaska Native population may be underreported by 30%, for the Asian or Pacific Islander population by 7%, and for the Hispanic-origin population by 5%. For more details, see Technical Notes in National Vital Statistics Reports, vol. 63, no. 3, “Deaths: Final data for 2011”; also see Vital and Health Statistics, Series 2, no. 148, “The validity of race and Hispanic origin reporting on death certificates in the United States.”
SOURCE: CDC/NCHS, National Vital Statistics System mortality data, 2009–2013. Available from CDC WONDER online database.
- Page last reviewed: November 6, 2015
- Page last updated: September 30, 2015
- Content source:


 ShareCompartir
