Healthy People 2000 Progress Review
Maternal and Infant Health
On this Page
Date: May 5, 1999
Time: 2-4 p.m.
A live broadcast from Washington, DC
Dr. David Satcher, Assistant Secretary for Health and Surgeon General, will be joined by a panel of experts representing the public and private health sectors. Dr. Edward Sondik, Director of the National Center for Health Statistics, Centers for Disease Control and Prevention (CDC); Peter C. van Dyke, M.D., M.P.H., Acting Associate Administrator for Maternal and Child Health, Health Resources and Services Administration; and David Erickson, D.D.S., Ph.D., Acting Director of the Division of Birth Defects and Pediatric Genetics, National Center for Environmental Health, CDC will review the progress towards the targets for the objectives in the Maternal and Infant Health priority area of Healthy People 2000. The participants will then engage in a discussion that focuses on three main topics.
- Reducing disparities in key Maternal, Infant, and Child Health indicators;
- Understanding issues surrounding preconception, prenatal, and obstetric care;
- Preventing birth defects and developmental disabilities: NTD and FAS.
Briefing Book Materials
Objective charts (color) [PDF - 1 MB]
Data Section
- Summary tables [PDF - 49 KB]
- Individual objectives table [PDF - 12 KB]
- Objective charts (black and white) [PDF - 1 MB]
Presentation
Edward J. Sondik, Ph.D.
Director, National Center for Health Statistics
May 5, 1999
Washington, DC
Thank you Dr. Satcher.
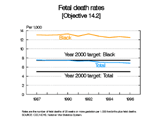
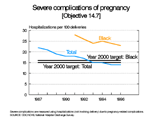
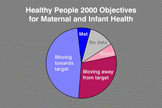
Chart 1. (Pie chart) I’m pleased to report significant progress in improving the health of mothers and infants. To summarize: Out of 17 objectives, we've met the target to reduce severe complications of pregnancy and we're moving toward the targets in 8 other objectives. For example, we’ve seen significant reductions in infant and fetal deaths and healthier practices during pregnancy. In fact, timely prenatal care is at the highest rate ever, fewer expectant mothers are smoking, and more gain the appropriate weight during their pregnancies.
But not all the trends are positive: Maternal mortality has not improved; low birthweight is at the highest level since 1973; and we may be seeing more infants born with Fetal Alcohol Syndrome.
And throughout these objectives, wide disparities are very evident, disparities by race, ethnicity, or by income and health care coverage.
Chart 2. (web addresses) By the way all the charts I’ll show this afternoon and several additional charts are on the NCHS Web site. The address is posted on the screen.
Let’s focus first on infant mortality--a figure used worldwide as one of the principal indicators of the health of a population.
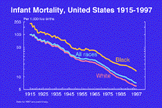
Chart 3. (IMR trends). There has been remarkable progress in reducing infant mortality. In the early 1900's one out of every 10 infants died in the first year of life; today fewer than 1 in 100 will fail to reach a first birthday. In 1997 the infant mortality rate reached a record low of 7.1 deaths per 1,000 live births, just barely missing the goal of 7, sure to be achieved before the decade ends. But in the face of this significant progress, we should note that the U.S. ranks 25th in the world in infant mortality. Twenty-four other nations--large and small--have had greater success in preventing infant deaths.
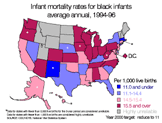
Chart 4. (IMR map). That is the overall picture of infant mortality. However, infant mortality rates vary greatly across the country. Note that many of the States in the west as well as a few others--shown in dark blue--have achieved the lowest rates. The almost solid block of southeastern States, in red, have the highest rates. The variation by race and ethnicity, which we’ll examine in the next chart, is the source of some--but by no means all--of the variation in this map.
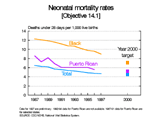
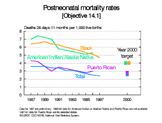
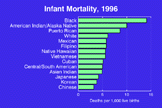
Chart 5. (IM detailed race/ethnicity) The infant mortality rates for African Americans, American Indian/Alaska Natives, and Puerto Ricans are the highest. While I’m pleased to say that the rates are declining, they are still considerably short of the targets set in Healthy People 2000. In 1997 the rate for black infants was the highest at almost 14 deaths per 1,000 births, compared to the lowest rate of under 4 for Chinese infants. Let’s look at some of the factors we know are affecting infant survival.
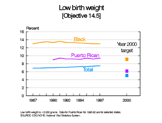
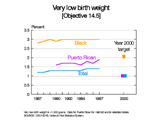
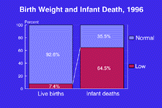
Chart 6. (LBW and mortality) Low birthweight is perhaps the most important factor associated with infant mortality. These infants weighing less than 5 1/2 lbs. make up 7 percent of all births--as shown in red on this chart--but account for about two-thirds of all infant deaths. Not shown on this chart but even more striking, is the fact that very low birthweight babies (weighing less than 3 and 1/4 lbs.) are only one percent of the infants born in the United States each year but they account for one-half of all infant deaths. And it is important to realize that even when infants survive, low birthweight may result in significant health problems into childhood and beyond. As a nation, we’re losing ground in reducing low birthweight. The percent of infants born at low birthweight in 1997 is at the highest level since 1973.
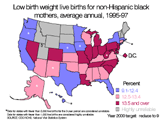
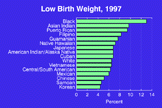
Chart 7. (LBW by race/ethnicity) Now let’s look again at disparities by race and ethnicity. The data show a threefold difference in low birthweight, ranging from 4 percent of Korean infants born at low birthweight to 13 percent of black infants.
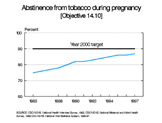
Chart 8. (Smoking and pregnancy) Smoking is another risk factor, of course for mothers, but also for their infants. Women who smoke cigarettes during pregnancy are almost twice as likely to have a low birthweight infant than women who don’t smoke. The chart shows that more women now abstain from smoking during pregnancy, nearing the goal of 90 percent. However there is a critical and growing problem. Smoking during pregnancy is up among teenagers, with large increases among black and Puerto Rican teens.
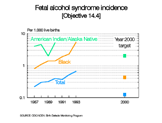
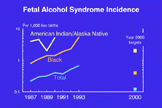
Chart 9. (FAS) Still another risk is alcohol use, with Fetal Alcohol Syndrome the most serious consequence. Earlier estimates from CDC's Birth Defects Monitoring Program indicate a rate of 67 cases per 100,000 births. A word of caution in interpreting the data--a portion of the increases, shown on this slide, may be due to improved reporting, however, there are some indications that FAS may be actually underestimated. A new CDC surveillance system--the FAS Network--coming soon will be able to more accurately report trends. Better monitoring is important because recent surveys report an increase in frequent and binge drinking among pregnant women.
Let me mention another birth defect--neural tube disorders such as spina bifida. Each year about 4,000 infants are born with some form of neural tube disorders and about half of these developmental defects could have been prevented with adequate folic acid intake by women before and during their pregnancy. Recognition of the benefits of folic acid has increased among women of childbearing age but the use of folic acid has not improved and rates of neural tube disorders are unchanged. Healthy People 2010 recognizes the importance of this topic with several proposed objectives to directly monitor folate intake and its levels in the population.
Chart 10. (SIDS trends) Turning to another important issue, Sudden Infant Death Syndrome or (SIDS). SIDS has been associated with preterm or low birthweight infants, late or no prenatal care, smoking, and substance abuse during pregnancy.
Research in the early part of the decade showed that infants who sleep on their back had a lower risk of SIDS. Back to Sleep, a national public education campaign, was launched to get that word out. Between 1992 and 1996, the percent of infants placed on their stomachs to sleep declined by 66 percent; that’s the left side of this chart. SIDS death rates had been declining, but between 1992 and 1996 the drop accelerated, down by an impressive 38 percent during this time period.
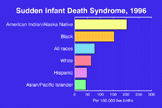
Chart 11. (SIDS by race/ethnicity) SIDS rates do vary for different groups, however. They are down among all population groups but the 1996 rate for American Indian/Alaskan Natives is almost five times that for Asian or Pacific Islanders. The rate is relatively low for Hispanics and whites and considerably higher for black infants.
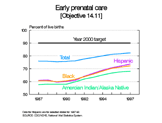
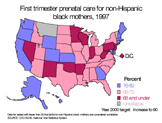
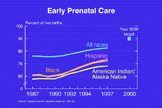
Chart 12. (Early Prenatal Care) Turning to an important intervention--early prenatal care--defined as care within the first trimester. Early prenatal care is the best opportunity for counseling and screening. Overall, the percent of women receiving first trimester care improved for the 8th consecutive year, rising to 83 percent in 1997. While there are still significant differences--as you can see on this chart, the groups at highest risk--as identified in Healthy People 2000--have shown remarkable strides in improving prenatal care.
Chart 13. (Cesareans) Another important aspect of maternal health is the method of delivery. Healthy People 2000 established a target of 15 cesareans for every 100 deliveries to balance the sometimes medical necessity of cesarean delivery with the greater risk of surgical complications, longer postoperative recovery and increased medical costs. After rising throughout the 1970's and 1980's to a high of 25 percent, cesarean rates have steadily declined in the 1990's to about 21 percent in 1997, when the decline appears to have stalled.
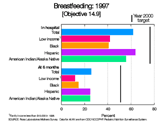
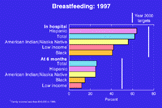
Chart 14. (Breast-feeding, race/ethnicity) Like cesarean deliveries, breast-feeding has also been the focus of public information and education efforts. The rate of breast-feeding by mothers in the hospital just after delivery is up by about 20 percent. The percent of infants being breast-fed at 6 months has nearly doubled since 1990. At both points in the infants’ first year, there are differences among population groups, with low income and black women the least likely to breast-feed their infants.
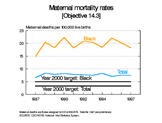
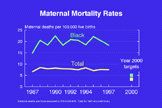
Chart 15. (Maternal Mortality) Our final chart illustrates a remaining challenge to improving maternal and infant health. In the early part of this century, the maternal mortality rate was 100 times what it is today, with 20,000 mothers dying in childbirth or of pregnancy related conditions each year. While we’ve seen enormous progress, still at least 300 women died of maternal causes in 1997. And we’ve seen no improvement over the past decade despite the fact that most of these deaths are preventable and despite the fact that we have made such excellent progress in other critical areas of maternal and infant health.
Slides Off. To summarize, most of these objectives show real progress. However, even as we have achieved this progress, significant disparities remain. Documenting the differences across the many indicators is an essential step in identifying the causes of disparities, pointing to effective interventions, setting priorities and finally closing the gaps. This is the process at the core of Healthy People and it is the foundation for Healthy People 2010, which calls for eliminating health disparities. Healthy People rests on turning the results of research into public health policy and public health action. The progress we’ve reported today has been possible only because it builds on a firm knowledge base on which the public and the health community can unite.
Thank you Dr. Satcher.
- Page last reviewed: November 6, 2015
- Page last updated: October 14, 2009
- Content source:


 ShareCompartir


