Financial Burden of Medical Care: A Family Perspective
On This Page
- Key findings
- More than one in four families experienced financial burdens of medical care.
- Families with lower incomes were more likely to experience financial burdens of medical care.
- Families with children were more likely than families without children to experience financial burdens of medical care.
- Families with an uninsured family member were more likely to have financial burdens of medical care.
- Summary
- Definitions
- Data source and methods
- About the authors
- References
- Suggested citation
NCHS Data Brief No. 142, January 2014
PDF Version (964 KB)
Robin A. Cohen, Ph.D., and Whitney K. Kirzinger, M.P.H.
Key findings
Data from the National Health Interview Survey, 2012
- In 2012, more than one in four families experienced financial burdens of medical care.
- Families with incomes at or below 250% of the federal poverty level (FPL) were more likely to experience financial burdens of medical care than families with incomes above 250% of the FPL.
- Families with children aged 0–17 years were more likely than families without children to experience financial burdens of medical care.
- The presence of a family member who was uninsured increased the likelihood that a family would experience a financial burden of medical care.
Recently published data from the National Health Interview Survey (NHIS) found that 1 in 5 persons was in a family having problems paying medical bills, and 1 in 10 persons was in a family with medical bills that they were unable to pay at all (1–3). NHIS defines “family” as an individual or a group of two or more related persons living together in the same housing unit. The family perspective is important to consider when examining financial risk because significant expenses for one family member may adversely affect the whole family. Health insurance coverage is one way for a family to mitigate financial risk associated with health care costs, although health insurance status may differ among family members. This report explores selected family demographic characteristics and their association with financial burdens of medical care (problems paying medical bills, paying medical bills over time, and having medical bills that cannot be paid) based on data from the 2012 NHIS.
Keywords: medical bills, insurance, poverty, family structure
More than one in four families experienced financial burdens of medical care.
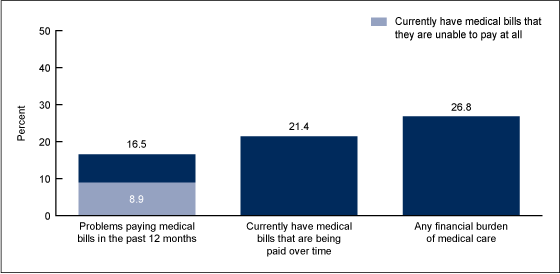
- In 2012, 26.8% of families in the United States experienced any financial burden of medical care (Figure 1).
- Almost 1 in 6 families (16.5%) had problems paying medical bills in the past 12 months, 1 in 10 families (8.9%) had medical bills that they were unable to pay at all (a subgroup of those having problems paying medical bills), and 1 in 5 families (21.4%) were paying medical bills over time.
Figure 1. Percentage of families with selected financial burdens of medical care: United States, 2012
NOTES: Data are based on household interviews of a sample of the civilian noninstitutionalized population. Any financial burden of medical care is based on a positive response to a question asking whether anyone in the family experienced “problems paying medical bills in the past 12 months” or a positive response to a question asking whether anyone in the family currently had “medical bills that are being paid over time.” Only those who responded positively to the former question were asked if they currently had medical bills that they were unable to pay at all.
SOURCE: CDC/NCHS, National Health Interview Survey, 2012.
Families with lower incomes were more likely to experience financial burdens of medical care.
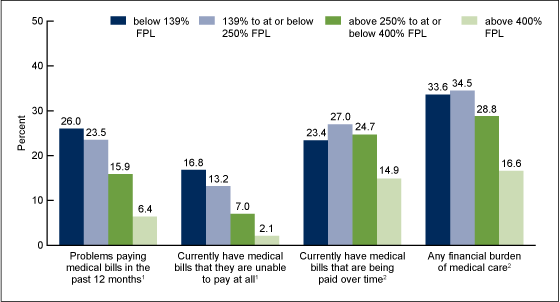
- Those families with incomes at or below 250% of the federal poverty level (FPL) had the highest levels of any financial burden of medical care (Figure 2).
- The percentage of families having problems paying medical bills and the percentage of families with medical bills that they were unable to pay at all (a subgroup of those having problems paying medical bills) decreased with increasing family incomes.
- Families with incomes ranging from 139% through 250% of the FPL were most likely to have been paying medical bills over time.
Figure 2. Percentage of families with selected financial burdens of medical care, by poverty level: United States, 2012
1Significant linear trend (p < 0.05).
2Significant quadratic trend (p < 0.05).
NOTES: Data are based on household interviews of a sample of the civilian noninstitutionalized population. Any financial burden of medical care is based on a positive response to a question asking whether anyone in the family experienced “problems paying medical bills in the past 12 months” or a positive response to a question asking whether anyone in the family currently had “medical bills that are being paid over time.” Only those who responded positively to the former question were asked if they currently had medical bills that they were unable to pay at all. FPL is federal poverty level.
SOURCE: CDC/NCHS, National Health Interview Survey, 2012.
Families with children were more likely than families without children to experience financial burdens of medical care.
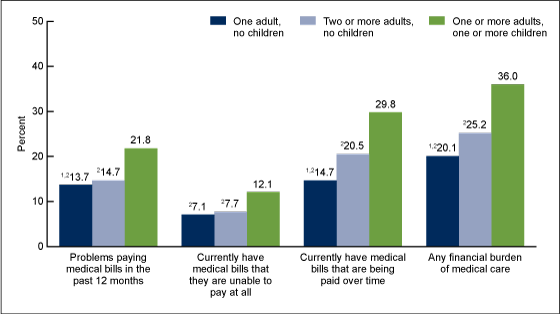
- One in three families with children (36.0%) experienced any financial burden of medical care (Figure 3).
- One in four families that included two or more adults with no children (25.2%) experienced any financial burden of medical care.
- One in five families with only one adult and no children (adults living alone), or 20.1%, experienced any financial burden of medical care.
- Families with children were more likely than families without children to experience problems paying medical bills, to have medical bills that they were unable to pay at all (a subgroup of those having problems paying medical bills), or to have medical bills that they had been paying over time.
- Adults living alone were less likely than families with two or more adults and no children to experience problems paying medical bills or to have medical bills that they had been paying over time.
Figure 3. Percentage of families with selected financial burdens of medical care, by number of adults and children aged 0–17 years in the family: United States, 2012
1Significantly different from families with two or more adults and no children (p < 0.05).
2Significantly different from families with one or more adults and one or more children (p < 0.05).
NOTES: Data are based on household interviews of a sample of the civilian noninstitutionalized population. Any financial burden of medical care is based on a positive response to a question asking whether anyone in the family experienced “problems paying medical bills in the past 12 months” or a positive response to a question asking whether anyone in the family currently had “medical bills that are being paid over time.” Only those who responded positively to the former question were asked if they currently had medical bills that they were unable to pay at all.
SOURCE: CDC/NCHS, National Health Interview Survey, 2012.
Families with an uninsured family member were more likely to have financial burdens of medical care.
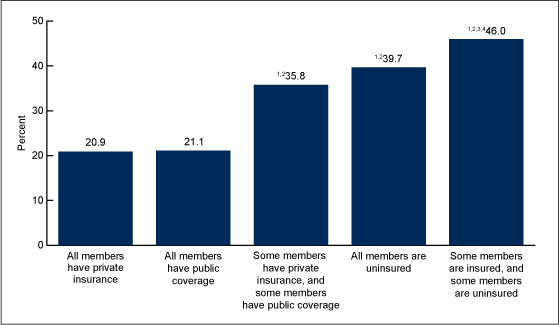
- Families with a mixture of coverage types within the family and families in which some or all members were uninsured were more likely to have experienced any financial burden of medical care in the past 12 months than were families in which either all members had private insurance or all members had public coverage (Figure 4).
- Among families in which all members had private insurance or all members had public coverage, approximately 21% experienced any financial burden of medical care.
- Among families in which some members had private insurance and some members had public coverage, 35.8% experienced any financial burden of medical care.
- Among families in which all members were uninsured, 39.7% experienced any financial burden of medical care.
- Among families in which some members were insured and some members were uninsured, 46.0% experienced any financial burden of medical care.
Figure 4. Percentage of families that had any financial burden of medical care in the past 12 months, by family health care coverage status: United States, 2012
1Significantly different from families in which all members have private insurance (p < 0.05).
2Significantly different from families in which all members have public coverage (p < 0.05).
3Significantly different from families in which some members have private insurance and some members have public coverage (p < 0.05).
4Significantly different from families in which all members are uninsured (p < 0.05).
NOTES: Data are based on household interviews of a sample of the civilian noninstitutionalized population. Any financial burden of medical care is based on a positive response to a question asking whether anyone in the family experienced “problems paying medical bills in the past 12 months” or a positive response to a question asking whether anyone in the family currently had “medical bills that are being paid over time.” Only those who responded positively to the former question were asked if they currently had medical bills that they were unable to pay at all.
SOURCE: CDC/NCHS, National Health Interview Survey, 2012.
Summary
Previous reports based on data from NHIS examined financial burdens of medical care from a person-level perspective (2,3). One strength of NHIS is that information on insurance and financial burden is collected at the family level, giving analysts the ability to look at both family-level and person-level data. The family perspective is a useful expansion of previous research because having one family member who contributes to the bulk of the financial burden for medical care may place the entire family’s ability to pay medical bills and overall financial well-being at risk. From a family level, this report found that levels of financial burden of medical care were greatest for families with incomes at or below 250% of the FPL, those with children, those with mixtures of coverage types, and those in which at least one family member was uninsured. Often, persons in families with more than one member can financially benefit from shared income and household expenses. However, when one family member experiences a financial burden of medical care, the entire family may be at risk for financial burden.
Definitions
Problems paying medical bills in past 12 months: Determined by the question, “In the past 12 months did [you/anyone in the family] have problems paying or an inability to pay any medical bills? Include bills for doctors, dentists, hospitals, therapists, medication, equipment, nursing home, or home care.”
Currently have medical bills that are being paid over time: Determined by the question, “[Do you/Does anyone in your family] currently have any medical bills that are being paid off over time? This could include medical bills being paid off with a credit card, through personal loans, or through bill paying arrangements with hospitals or other providers. The bills can be from earlier years as well as this year.”
Currently have medical bills that they are unable to pay at all: Identified by the question, “[Do you/Does anyone in your family] currently have any medical bills that you are unable to pay at all?” This question was asked only of those who had problems paying medical bills in the past 12 months.
Any financial burden of medical care: Based on a positive response to the question asking whether anyone in the family had “problems paying medical bills in the past 12 months” or a positive response to “currently have medical bills that are being paid over time.” Only those who responded positively to the former question were asked if they currently had medical bills that they were unable to pay at all.
Family: Defined as an individual or a group of two or more related persons who are living together in the same occupied housing unit (i.e., household) in the sample. In some instances, unrelated persons sharing the same household could also be considered a family, such as an unmarried couple living together.
Federal poverty level: Based on family income and family size using the U.S. Census Bureau’s poverty thresholds for the previous calendar year. The 2012 NHIS imputed income files were used to help create the poverty variable.
Health insurance coverage at interview: The “private” coverage category excludes plans that pay for only one type of service, such as accidents or dental care. The “public” coverage category includes Medicaid, the Children’s Health Insurance Program (CHIP), state-sponsored or other government-sponsored health plans, Medicare, and military plans. A person was defined as uninsured if, at the time of the interview, he or she did not have any private health insurance, Medicare, Medicaid, CHIP, state-sponsored or other government-sponsored health plan, or military plan. A person was also defined as uninsured if he or she had only Indian Health Service coverage or had only a private plan that paid for one type of service, such as accidents or dental care. In this analysis, health insurance categories are hierarchical, and persons covered by both private coverage and public coverage were considered to have private coverage. The analysis by insurance coverage excluded persons with unknown health insurance status (about 1% of respondents each year).
Data source and methods
This analysis used data from the 2012 NHIS. Interviewers from the U.S. Census Bureau collect NHIS data continuously throughout the year for the Centers for Disease Control and Prevention’s National Center for Health Statistics (NCHS). NHIS collects information about the health and health care of the civilian noninstitutionalized U.S. population. Although active-duty Armed Forces personnel are excluded from the survey, their civilian family members are included. (For example, a child whose parents are both active-duty military personnel would be included, but the parents would not.) Interviews are conducted in respondents’ homes, but follow-ups to complete interviews may be conducted over the telephone. Questions about financial burden of medical care and health insurance coverage are from the Family Core component, which collects information on all family members. Information was collected for 43,345 families on 108,131 persons. For further information about NHIS, including the questionnaire, see the NHIS website.
NHIS is designed to yield a sample representative of the civilian noninstitutionalized population of the United States, and weights are used to produce national estimates. Data weighting procedures are described in more detail elsewhere (4). Point estimates and logistic regression models for linear and quadratic poverty trends were calculated using SUDAAN software (5) to account for the complex sample design of NHIS. The Taylor series linearization method was chosen for variance estimation. All estimates shown in this report meet the NCHS standard of reliability (relative standard error less than or equal to 30%). Differences between percentages were evaluated using two-sided significance tests at the 0.05 level.
About the authors
Robin A. Cohen and Whitney K. Kirzinger are with CDC’s National Center for Health Statistics, Division of Health Interview Statistics.
References
- Sommers A, Cunningham PJ. Medical bill problems steady for U.S. families, 2007–2010. Tracking Report no 28. Washington, DC: Center for Studying Health System Change. 2011.
- Cohen RA, Gindi RM, Kirzinger WK. Financial burden of medical care: Early release of estimates from the National Health Interview Survey, January–June 2011. Hyattsville, MD: National Center for Health Statistics. 2012.
- Cohen RA, Kirzinger WK, Gindi RM. Problems paying medical bills: Early release of estimates from the National Health Interview Survey, January 2011–June 2012. Hyattsville, MD: National Center for Health Statistics. 2013.
- Botman SL, Moore TF, Moriarity CL, Parsons VL. Design and estimation for the National Health Interview Survey, 1995–2004. National Center for Health Statistics. Vital Health Stat 2(130). 2000.
- RTI International. SUDAAN (Release 10.0) [computer software]. 2008.
Suggested citation
Cohen RA, Kirzinger WK. Financial burden of medical care: A family perspective. NCHS data brief, no 142. Hyattsville, MD: National Center for Health Statistics. 2014.
Copyright information
All material appearing in this report is in the public domain and may be reproduced or copied without permission; citation as to source, however, is appreciated.
National Center for Health Statistics
Charles J. Rothwell, M.S., M.B.A., Director
Jennifer H. Madans, Ph.D., Associate Director for Science
Division of Health Interview Statistics
Jane F. Gentleman, Ph.D., Director
- Page last reviewed: November 6, 2015
- Page last updated: January 28, 2014
- Content source:


 ShareCompartir


