Strategies Used by Adults to Reduce Their Prescription Drug Costs: United States, 2013
On This Page
- Key findings
- Adults used several strategies to reduce prescription drug costs.
- Adults aged 18–64 were almost twice as likely as adults aged 65 and over to have skipped doses, to have taken less medicine, and to have delayed filling a prescription to save money.
- Among adults aged 18–64, uninsured persons were more likely than those with Medicaid or private coverage to have used strategies to save money on prescription drugs.
- Among adults aged 65 and over, strategies used to save money on prescription drugs varied by insurance type.
- The poorest adults were the most likely to not take medication as prescribed to save money.
- Summary
- Definitions
- Data source and methods
- About the authors
- References
- Suggested citation
NCHS Data Brief No. 184, January 2015
PDF Version (694 KB)
Robin A. Cohen, Ph.D.; and Maria A. Villarroel, Ph.D.
Key findings
Data from the National Health Interview Survey, 2013
- To save money, almost 8% of U.S. adults (7.8%) did not take their medication as prescribed, 15.1% asked a doctor for a lower-cost medication, 1.6% bought prescription drugs from another country, and 4.2% used alternative therapies.
- Adults aged 18–64 (8.5%) were nearly twice as likely as adults aged 65 and over (4.4%) to have not taken their medication as prescribed to save money.
- Among adults aged 18–64, uninsured adults (14.0%) were more likely than those with Medicaid (10.4%) or private coverage (6.1%) to have not taken their medication as prescribed to save money.
- The poorest adults—those with incomes below 139% of the federal poverty level—were the most likely to not take medication as prescribed to save money.
Approximately one-fifth (18%) of the $263 billion spent on retail prescription drugs in the United States in 2012 was paid out of pocket (1). Some adults offset the cost of prescription drugs by reducing the dosage and frequency of the recommended pharmacotherapy (2–3). Other cost-saving strategies include asking providers for less-expensive medications or purchasing medications abroad (4). This report updates previously reported estimates for strategies used by U.S. adults aged 18 and over to reduce their prescription drug costs (5), using data from the 2013 National Health Interview Survey.
Keywords: medication, expense, National Health Interview Survey
Adults used several strategies to reduce prescription drug costs.
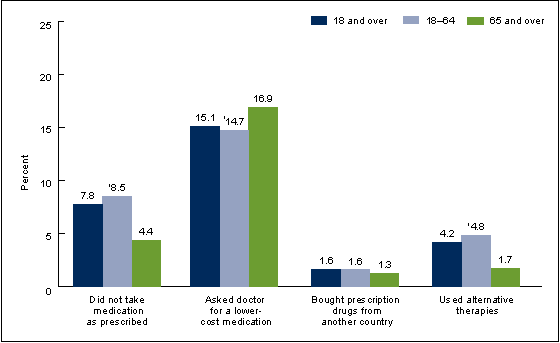
- Almost 8% of U.S. adults aged 18 and over (7.8%) did not take medication as prescribed, to save money; 15.1% asked a doctor for a lower-cost medication, 1.6% bought prescription drugs from another country, and 4.2% used alternative therapies (Figure 1).
- Adults aged 18–64 (8.5%) were about twice as likely as adults aged 65 and over (4.4%) to have not taken their medication as prescribed to save money.
- Adults aged 65 and over (16.9%) were more likely than adults aged 18–64 (14.7%) to have asked their doctor for a lower-cost medication to save money.
- About 5% of adults aged 18–64 had used alternative therapies to save money on prescription drugs, compared with 1.7% of adults aged 65 and over.
- Less than 2% of adults had bought prescription drugs from another country to save money.
Figure 1. Percentages of adults who used selected strategies to reduce prescription drug costs in the last 12 months, by age group: United States, 2013
1Significantly different from adults aged 65 and over (p < 0.05).
NOTES: “Did not take medication as prescribed” is a composite measure that includes adults who “skipped medication doses,” “took less medicine,” or “delayed filling a prescription.” See the Definitions section for further details. A person may use more than one strategy to reduce prescription drug costs.
SOURCE: CDC/NCHS, National Health Interview Survey, 2013.
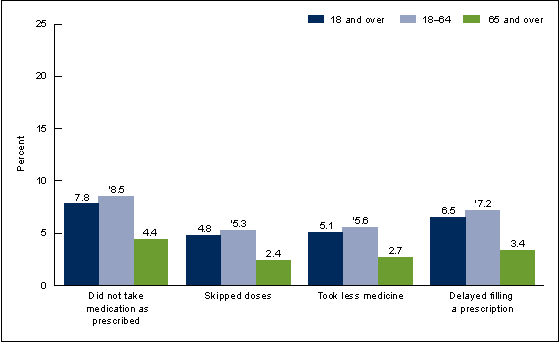
Adults aged 18–64 were almost twice as likely as adults aged 65 and over to have skipped doses, to have taken less medicine, and to have delayed filling a prescription to save money.
- Among adults aged 18–64, 5.3% skipped doses and 5.6% took less medication to save money, compared with 2.4% and 2.7%, respectively, of adults aged 65 and over (Figure 2).
- Among adults aged 18–64, 7.2% delayed filling a prescription to save money, compared with 3.4% of adults aged 65 and over.
Figure 2. Percentages of adults who did not take their medication as prescribed in the past 12 months to save money, by strategy and age group: United States, 2013
1Significantly different from adults aged 65 and over (p < 0.05).
NOTES: “Did not take medication as prescribed” is a composite measure that includes adults who “skipped medication doses,” “took less medicine,” or “delayed filling a prescription.” See the Definitions section for further details. A person may use more than one strategy to reduce prescription drug costs.
SOURCE: CDC/NCHS, National Health Interview Survey, 2013.
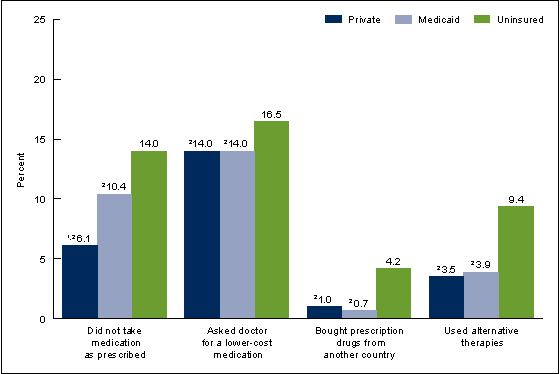
Among adults aged 18–64, uninsured persons were more likely than those with Medicaid or private coverage to have used strategies to save money on prescription drugs.
- Adults aged 18–64 who were uninsured were more likely to have asked their doctor for a lower-cost medication (16.5%), to have not taken their medication as prescribed (14.0%), to have used alternative therapies (9.4%), and to have bought prescription drugs from another country (4.2%) to save money, compared with those who had private coverage (14.0%, 6.1%, 3.5%, and 1.0%, respectively) and those who had Medicaid coverage (14.0%, 10.4%, 3.9%, and 0.7%, respectively) (Figure 3).
- Those who had Medicaid coverage (10.4%) were more likely than those with private coverage (6.1%) to have not taken medication as prescribed to save money.
Figure 3. Percentages of adults aged 18–64 who used selected strategies to reduce prescription drug costs in the past 12 months, by health insurance coverage status: United States, 2013
1Significantly different from those with Medicaid coverage (p < 0.05).
2Significantly different from those who were uninsured (p < 0.05).
NOTES: “Did not take medication as prescribed” is a composite measure that includes adults who “skipped medication doses,” “took less medicine,” or “delayed filling a prescription.” See the Definitions section for further details. A person may use more than one strategy to reduce prescription drug costs.
SOURCE: CDC/NCHS, National Health Interview Survey, 2013.
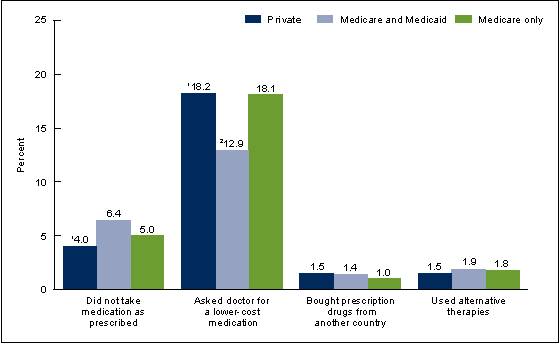
Among adults aged 65 and over, strategies used to save money on prescription drugs varied by insurance type.
- Adults aged 65 and over who had private coverage were less likely to have tried to save money by not taking medication as prescribed (4.0%), compared with those who had both Medicare and Medicaid coverage (6.4%) (Figure 4).
- Those who had only Medicare coverage (18.1%) or those who had private coverage (18.2%) were more likely to have asked their doctor for a lower-cost medication to save money, compared with those who had both Medicare and Medicaid coverage (12.9%).
- There were no differences by health insurance coverage in the percentage who bought prescription drugs from another country or used alternative therapies to save money.
Figure 4. Percentages of adults aged 65 and over who used selected strategies to reduce prescription drug costs in the past 12 months, by health insurance coverage status: United States, 2013
1Significantly different from those with Medicare and Medicaid coverage (p < 0.05).
2Significantly different from those with Medicare-only coverage (p < 0.05).
NOTES: “Did not take medication as prescribed” is a composite measure that includes adults who “skipped medication doses,” “took less medicine,” or “delayed filling a prescription.” See the Definitions section for further details. A person may use more than one strategy to reduce prescription drug costs.
SOURCE: CDC/NCHS, National Health Interview Survey, 2013.
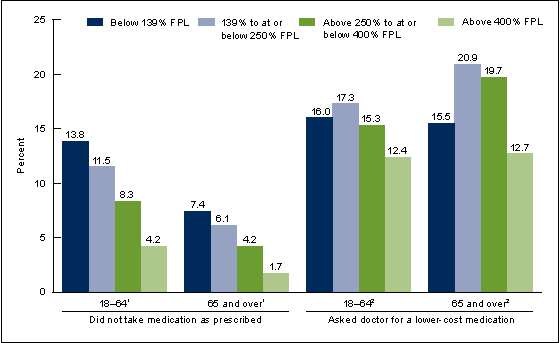
The poorest adults were the most likely to not take medication as prescribed to save money.
- The percentage of adults who did not take medication as prescribed to save money decreased as income increased among all adults aged 18 and over (Figure 5).
- Among adults aged 18–64, the percentage who asked their doctor for a lower-cost medication to save money was highest among those with incomes at or below 250% of the federal poverty level (FPL). The percentages decreased from 17.3% for those with incomes from 139% through 250% FPL to 12.4% among those with incomes above 400% FPL.
- Among adults aged 65 and over, the percentage who asked their doctor for a lower-cost medication to save money increased from 15.5% among those with incomes below 139% FPL, to 20.9% among those with incomes from 139% through 250% FPL, and 19.7% among those with incomes from above 250% through 400% FPL, and then decreased to 12.7% for those with incomes above 400% FPL.
Figure 5. Percentages of adults who did not take medication as prescribed and who asked a doctor for a lower-cost medication in the past 12 months, by age group and poverty status: United States, 2013
1Significant linear trend (p < 0.05).
2Significant quadratic trend (p < 0.05).
NOTES: FPL is federal poverty level. Poverty categories are based on the ratio of the family’s income in the previous calendar year to the appropriate poverty threshold (given the family’s size and number of children) defined by the U.S. Census Bureau for that year. A person may use more than one strategy to reduce prescription drug costs.
SOURCE: CDC/NCHS, National Health Interview Survey, 2013.
Summary
Among U.S. adults aged 18–64, strategies for reducing prescription drug costs were more commonly practiced by those who were uninsured than those who had public or private coverage. Lack of health insurance coverage and poverty are recognized risk factors for not taking medication as prescribed due to cost (2). This cost-saving strategy may result in poorer health status and increased emergency room use and hospitalizations, compared with adults who follow their recommended pharmacotherapy (6-7). It is unknown whether adverse health outcomes and higher health care costs are also associated with the cost-reduction strategies of alternative therapy use or obtaining prescription drugs from abroad (8-9).
Among adults aged 65 and over, those covered by both Medicare and Medicaid were more likely to have not taken their medication as prescribed to save money, but were less likely to have asked their doctor for a lower-cost prescription, than those who had private insurance coverage. Differences in cost-saving strategies by insurance coverage may be interrelated with socioeconomic and other patient characteristics. Belief that the recommended pharmacotherapy is needed, and an understanding of the recommended treatment, have been found to be lower among older adults who are economically vulnerable, compared with those with higher income (10). Income was also associated with the use of cost-reduction strategies. Among adults aged 65 and over, those living with incomes at 139%–400% FPL were more likely than adults living in lower or higher income thresholds to have asked their provider for a lower-cost prescription to save money. These patterns in the estimates by insurance status and poverty level are similar to those previously reported using the 2011 NHIS data (5)
Definitions
Strategies for reducing prescription drug costs: Based on the following questions: The following questions concern the use of prescription medication: During the past 12 months, are any of the following true for you? …[1] You skipped medication doses to save money …[2] You took less medicine to save money …[3] You delayed filling a prescription to save money …[4] You asked your doctor for a lower-cost medication to save money …[5] You bought prescription drugs from another country to save money …[6] You used alternative therapies to save money. In contrast to previous survey years, adults in 2013 were asked questions 1 through 3 only if they reported having been prescribed medication by a doctor or other health care provider during the past 12 months. Adults who were not prescribed medication in the past 12 months are included in the denominator of the estimates pertaining to questions 1 through 3. All adults were asked questions 4 through 6, including those who might not be taking prescription medication.
Did not take medication as prescribed: Based on a positive response to any of the following three questions described previously: …You skipped medication doses to save money …You took less medicine to save money … You delayed filling a prescription to save money.
Health insurance coverage: Respondents were asked about their health insurance coverage at the time of interview. They reported whether they were covered by private insurance, Medicare, Medigap (supplemental Medicare coverage), Medicaid, Children’s Health Insurance Program (CHIP), Indian Health Service (IHS), military coverage, a state-sponsored health plan, another government program, or any single-service plans. Adults with both private coverage and some type of public coverage (e.g., Medicaid or Medicare) were classified as having private coverage (11).
Poverty status and percentage of poverty level: Based on reported or imputed family income, family size, and the number of children in the family, and, for families with two or fewer adults, on the age of the adults in the family. Poverty levels are updated annually by the U.S. Census Bureau to reflect changes in the Consumer Price Index. For further information, visit the U.S. Census Bureau website. Note that NHIS asked respondents about their personal earnings and family income for the previous calendar year (2012). Family income was imputed for 22.7% of persons in 2013 (12).
Data source and methods
Data from the 2013 NHIS were used for this analysis. NHIS data are collected continuously throughout the year for the Centers for Disease Control and Prevention’s (CDC) National Center for Health Statistics (NCHS) by interviewers from the U.S. Census Bureau. NHIS collects information about the health and health care of the civilian noninstitutionalized population of the United States. Interviews are conducted in respondents’ homes, but follow-ups to complete interviews may be conducted over the telephone. The Family component collects information on all family members, and the Sample Adult component collects additional data from one randomly selected adult (the “sample adult”). Questions about strategies to reduce prescription drug cost are from the Sample Adult component. In 2013, information was collected on a total of 34,557 sample adults aged 18 and over. For further information about NHIS, including the questionnaire, see the NHIS website.
NHIS is designed to yield a nationally representative sample, and this analysis used weights to produce national estimates. Data weighting procedures are described in more detail elsewhere (13). All estimates shown in this report meet the NCHS standard of reliability (relative standard error less than or equal to 30%). Differences between percentages were evaluated using two-sided significance tests at the 0.05 level.
About the authors
Robin A. Cohen and Maria A. Villarroel are with CDC’s National Center for Health Statistics, Division of Health Interview Statistics.
References
- Centers for Medicare & Medicaid Services. National health expenditure data.
- Briesacher BA, Gurwitz JH, Soumerai SB. Patients at-risk for cost-related medication nonadherence: A review of the literature. J Gen Intern Med 22(6):864–71. 2007.
- Piette JD, Rosland AM, Silveira MJ, Hayward R, McHorney CA. Medication cost problems among chronically ill adults in the US: Did the financial crisis make a bad situation even worse? Patient Prefer Adherence 5:187–94. 2011.
- Nekhlyudov L, Madden J, Graves AJ, Zhang F, Soumerai SB, Ross-Degnan D. Cost-related medication nonadherence and cost-saving strategies used by elderly Medicare cancer survivors.
J Cancer Surviv 5(4):395–404. 2011. - Cohen RA, Kirzinger WK, Gindi RM. Strategies used by adults to reduce their prescription drug costs. NCHS Data Brief, no 119. Hyattsville, MD: National Center for Health Statistics. 2013.
- Heisler M, Choi H, Rosen AB, Vijan S, Kabeto M, Langa KM, Piette JD. Hospitalizations and deaths among adults with cardiovascular disease who underuse medications because of cost: A longitudinal analysis. Med Care 48(2):87–94. 2010.
- Jha AK, Aubert RE, Yao J, Teagarden JR, Epstein RS. Greater adherence to diabetes drugs is linked to less hospital use and could save nearly $5 billion annually. Health Aff (Millwood) 31(8):1836–46. 2012.
- Herman PM, Poindexter BL, Witt CM, Eisenberg DM. Are complementary therapies and integrative care cost-effective? A systematic review of economic evaluations. BMJ Open 2(5):e001046. 2012.
- Hubbard WK. Safety of prescription drugs from foreign sources. Statement before the Subcommittee on Human Rights and Wellness, House Committee on Government Reform, June 12, 2003.
- Piette JD, Beard A, Rosland AM, McHorney CA. Beliefs that influence cost-related medication non-adherence among the “haves” and “have nots” with chronic diseases. Patient Prefer Adherence 5:389–96. 2011.
- Adams PF, Kirzinger WK, Martinez ME. Summary health statistics for the U.S. population: National Health Interview Survey, 2012 [PDF – 2.4 MB]. National Center for Health Statistics. Vital Health Stat 10(259). 2013.
- NCHS. Multiple imputation of family income and personal earnings in the National Health Interview Survey: Methods and examples. Hyattsville, MD: NCHS, Division of Health Interview Statistics.
- Parsons VL, Moriarity CL, Jonas K, et al. Design and estimation for the National Health Interview Survey, 2006–2015 [PDF 1.4 MB]. National Center for Health Statistics. Vital Health Stat 2(165). 2014.
Suggested citation
Cohen RA, Villarroel MA. Strategies used by adults to reduce their prescription drug costs: United States, 2013. NCHS data brief, no 184. Hyattsville, MD: National Center for Health Statistics. 2015.
Copyright information
All material appearing in this report is in the public domain and may be reproduced or copied without permission; citation as to source, however, is appreciated.
National Center for Health Statistics
Charles J. Rothwell, M.S., M.B.A., Director
Jennifer H. Madans, Ph.D., Associate Director for Science
Division of Health Interview Statistics
Marcie L. Cynamon, Acting Director
- Page last reviewed: November 6, 2015
- Page last updated: January 29, 2015
- Content source:


 ShareCompartir
