Prescription Drug Use Continues to Increase: U.S. Prescription Drug Data for 2007-2008
On This Page
- Key findings
- What are the trends in prescription drug use in the United States over the past 10 years?
- What percentage of Americans used multiple prescription drugs in the past month and how did this vary by age?
- Did prescription drug use vary among demographic subgroups?
- What is the relationship between access to health care services and prescription drug use?
- What were the most frequently used types of prescription drugs?
- Summary
- Definitions
- Data source and methods
- About the authors
- References
- Suggested citation
NCHS Data Brief No. 42, September 2010
PDF Version (659 KB)
Qiuping Gu, M.D., Ph.D.; Charles F. Dillon, M.D., Ph.D.; and Vicki L. Burt, Sc.M., R.N.
Key findings
- Over the last 10 years, the percentage of Americans who took at least one prescription drug in the past month increased from 44% to 48%. The use of two or more drugs increased from 25% to 31%. The use of five or more drugs increased from 6% to 11%.
- In 2007-2008, 1 out of every 5 children and 9 out of 10 older Americans reported using at least one prescription drug in the past month.
- Those who were without a regular place for health care, health insurance, or prescription drug benefit had less prescription drug use compared with those who had these benefits.
- The most commonly used types of drugs included: asthma medicines for children, central nervous system stimulants for adolescents, antidepressants for middle-aged adults, and cholesterol lowering drugs for older Americans.
In the United States, spending for prescription drugs was $234.1 billion in 2008, which was more than double what was spent in 1999 (1). As new drugs are introduced and new uses for old drugs are found, more patients can have improved health and quality of life with the appropriate use of prescription drugs. Current prescription drug use patterns need to be better understood. This report provides an overview of current prescription drug use in the United States, how many and what kinds of drugs are currently being prescribed, and who receives them.
Keywords: National Health and Nutrition Examination Survey (NHANES), medication, prevalence, trends
What are the trends in prescription drug use in the United States over the past 10 years?
Prescription drug use in the United States increased from 1999-2000 through 2007-2008 (Figure 1).
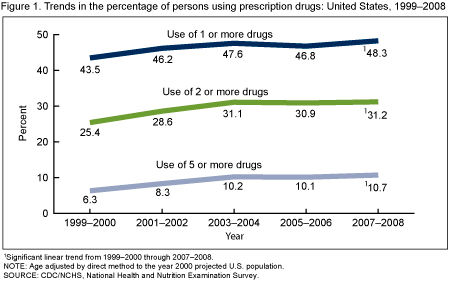
- The percentage of Americans who used at least one prescription drug in the past month increased from 44% in 1999-2000 to 48% in 2007-2008.
- The percentage of persons who used two or more prescription drugs increased from 25% in 1999-2000 to 31% in 2007-2008.
- The percentage of persons who used five or more prescription drugs increased from 6% in 1999-2000 to 11% in 2007-2008.
What percentage of Americans used multiple prescription drugs in the past month and how did this vary by age?
The use of multiple prescription drugs in the past month varied by age (Figure 2).
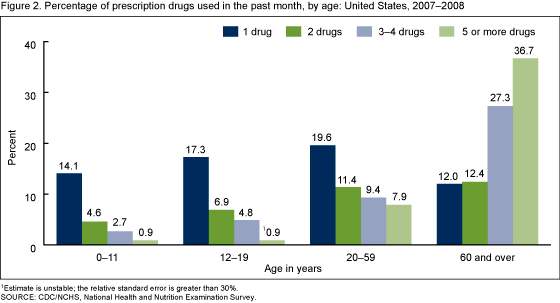
- Among children (under age 12), less than 10% used two or more prescription drugs in the past month and only 1% used five or more.
- Among older Americans (aged 60 and over), more than 76% used two or more prescription drugs and 37% used five or more.
Did prescription drug use vary among demographic subgroups?
There were differences in prescription drug use by age, sex, and race and ethnicity (Figure 3).
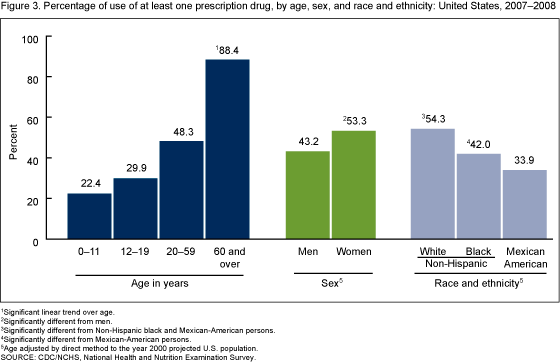
- Prescription drug use increased with age.
- Women were more likely to use prescription drugs than men.
- The non-Hispanic white population had the highest prescription drug use and the Mexican-American population had the lowest.
What is the relationship between access to health care services and prescription drug use?
Having a regular source of health care, health insurance, and health insurance with prescription drug benefits were all associated with increased use of prescribed medicines (Figure 4).
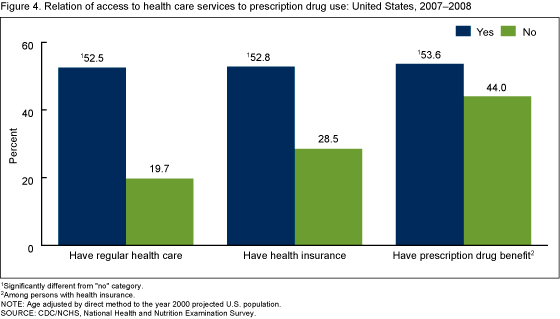
- Persons with a regular place for health care were 2.7 times as likely to have used prescription drugs in the past month as those without a regular place for health care.
- Those with health insurance were almost twice as likely to have used at least one prescription drug in the past month as those without health insurance coverage.
- Among people with health insurance, those having a prescription drug benefit were 22% more likely to use prescription drugs than those who did not have this benefit.
What were the most frequently used types of prescription drugs?
The types of prescription drugs used by Americans varied by age (Figure 5).
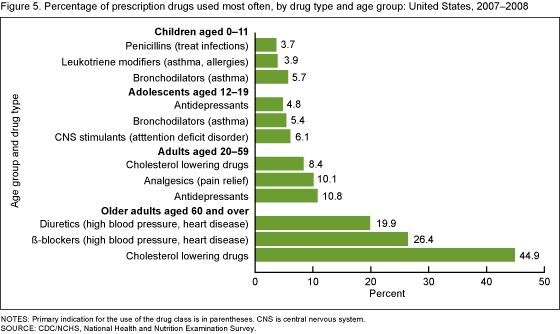
The most commonly used types of prescription drugs in the United States by age were:
- Bronchodilators for children aged 0-11.
- Central nervous system stimulants for adolescents aged 12-19.
- Antidepressants for adults aged 20-59.
- Cholesterol lowering drugs for adults aged 60 and over.
Among children under age 6, penicillin antibiotics were the most frequently used prescription drugs.
Diuretics and β-blockers were also very commonly used drugs in adults and older Americans. These are usually used to treat high blood pressure and heart problems.
Summary
Over the last decade the percentage of Americans who took at least one prescription drug in the past month increased by 10%. The use of multiple prescription drugs increased by 20% and the use of five or more drugs increased by 70%. By 2007-2008, one-half of Americans used at least one or more prescription drugs; and 1 out of 10 used five or more. One out of every five children used at least one or more prescription drugs compared with 9 of every 10 adults aged 60 and over. Women were more likely to use prescription drugs than were men. Those who were without a regular place for health care, health insurance, or prescription drug benefit were less likely to have used prescription medication compared with their counterparts.
The types of prescription drugs that were most commonly used were asthma medicines for children, central nervous system stimulants for adolescents, antidepressants for middle-aged adults, and cholesterol lowering and high blood pressure drugs for older Americans. These patterns reflect the main chronic diseases common at these ages, but may also likely reflect more aggressive treatments for chronic medical conditions such as high cholesterol and high blood pressure as recommended in the updated clinical guidelines (2,3).
Those without a regular place for health care, health insurance, or prescription drug benefits had lower prescription drug use rates. Lack of access to medicines may impact health and quality of life, as prescription drugs are essential to treat acute and chronic diseases.
Finally, almost 40% of older Americans used five or more prescription drugs in the past month. This likely reflects the need to treat the many diseases that commonly occur in this age group; however, excessive prescribing or polypharmacy is also an acknowledged safety risk for older Americans, and a continuing challenge that may contribute to adverse drug events, medication compliance issues, and increased health care costs (4-6).
Definitions
Prescription drug use: National Health and Nutrition Examination Survey (NHANES) participants were asked if they had taken a prescription drug in the past month. Those who answered “yes” were asked to show the interviewer the medication containers of all prescription drugs. For each drug reported, the interviewer recorded the product’s complete name from the container (7).
Therapeutic drug class (type of drugs): Prescription drugs were classified based on the three-level nested therapeutic classification scheme of Cerner Multum’s Lexicon. Up to four classes were assigned to each drug. The most commonly cited second level of drug categorical codes were used in this analysis (7).
Health care access: Based on the question, “Is there a place you usually go when you are sick or you need advice about your health?”
Health insurance coverage: Based on the question, “Are you covered by health insurance or some other kind of health care plan?”
Prescription drug benefit: Based on the question, “Do any of these plans cover any part of cost of prescriptions?”
Data source and methods
NHANES data were used for these analyses (7). NHANES is designed to monitor the health and nutritional status of the civilian noninstitutionalized U.S. population. NHANES is nationally representative. Sample weights, accounting for the differential probabilities of selection, nonresponse, and noncoverage were used for analyses. Variance estimates accounted for the complex survey design using Taylor series linearization. Apart from age-specific estimates, all estimates were age adjusted to the 2000 U.S. standard population using four age groups: under age 12, 12-19, 20-59, and 60 and over (8). Trends were tested to evaluate changes in estimates across survey periods and age groups. Differences among groups were evaluated using a univariate t statistic. All significance tests were two-sided using p < 0.05 as the level of statistical significance. For comparison of estimates by race and ethnic groups, adjustments for multiple comparisons were made using the Bonferroni method (9). Reported differences are statistically significant unless otherwise indicated. Statistical analyses were conducted using SAS version 9.2 (SAS Institute, Cary, N.C.) and SUDAAN version 10.0 (Research Triangle Institute, Research Triangle Park, N.C.).
About the authors
Qiuping Gu, Charles F. Dillon, and Vicki L. Burt are with the Centers for Disease Control and Prevention’s National Center for Health Statistics, Division of Health and Nutrition Examination Surveys.
References
- Centers for Medicare & Medicaid Services. National Health Expenditure Accounts, Historical.
- National Cholesterol Education Program expert panel on Detection, Evaluation, and Treatment of High Blood Cholesterol in Adults (Adult Treatment Panel III). Third report of the National Cholesterol Education Program (NCEP) expert panel on Detection, Evaluation, and Treatment of High Blood Cholesterol in Adults (Adult Treatment Panel III) final report. Circulation 106(25):3143-421. 2002.
- Chobanian AV, Bakris GL, Black HR, Cushman WC, Green LA, Izzo JL Jr, et al. Seventh report of the Joint National Committee on Prevention, Detection, Evaluation, and Treatment of High Blood Pressure. Hypertension 42(6):1206-52. 2003.
- Qato DM, Alexander GC, Conti RM, Johnson M, Schumm P, Lindau ST. Use of prescription and over-the-counter medications and dietary supplements among older adults in the United States. JAMA 300(24):2867-78. 2008.
- O’Mahony D, Gallagher PF. Inappropriate prescribing in the older population: Need for new criteria. Age Ageing 37(2):138-41. 2008.
- Trygstad TK, Christensen DB, Wegner SE, Sullivan R, Garmise JM. Analysis of the North Carolina long-term care polypharmacy initiative: A multiple-cohort approach using propensity-score matching for both evaluation and targeting. Clin Ther 31(9):2018-37. 2009.
- CDC. National Center for Health Statistics. National Health and Nutrition Examination Surveys, 1999-2008.
- Klein RJ, Schoenborn CA. Age adjustment using the 2000 projected U.S. population. Healthy People Statistical Notes, no 20. Hyattsville, MD: National Center for Health Statistics. 2001.
- Miller RG Jr. Developments in multiple comparisons 1966-1976. J Am Stat Assoc 72(360):779-88. 1977.
Suggested citation
Gu Q, Dillon CF, Burt VL. Prescription drug use continues to increase: U.S. prescription drug data for 2007-2008. NCHS data brief, no 42. Hyattsville, MD: National Center for Health Statistics. 2010.
Copyright information
All material appearing in this report is in the public domain and may be reproduced or copied without permission; citation as to source, however, is appreciated.
National Center for Health Statistics
Edward J. Sondik, Ph.D., Director
Jennifer H. Madans, Ph.D., Associate Director for Science
Division of Health and Nutrition Examination Surveys
Cliff L. Johnson, M.S.P.H., Director
- Page last reviewed: November 6, 2015
- Page last updated: September 2, 2010
- Content source:


 ShareCompartir