Nurse Practitioners, Certified Nurse Midwives, and Physician Assistants in Physician Offices
On This Page
- Key findings
- Primary care physicians were more likely to work with NPs, CNMs, or PAs than physicians in other specialties.
- NPs, CNMs, or PAs were most likely to be associated with physicians who worked in large group practices.
- Physicians in multi-specialty group practices were most likely to work with NPs, CNMs, or PAs.
- Older office-based physicians were less likely to work with NPs, CNMs, or PAs.
- Physicians in practices with more revenue from Medicaid and less revenue from Medicare were more likely than others to work with NPs, CNMs, or PAs.
- Summary
- Definitions
- Data source and methods
- About the authors
- References
- Suggested citation
NCHS Data Brief No. 69, August 2011
PDF Version (725 KB)
Melissa Park, M.P.H.; Donald Cherry, M.S.; and Sandra L. Decker, Ph.D.
Key findings
Data from the National Ambulatory Medical Care Survey, 2009
- In 2009, 49.1% of office-based physicians were in practices that used nurse practitioners (NPs), certified nurse midwives (CNMs), or physician assistants (PAs).
- Primary care physicians were more likely to have NPs, CNMs, or PAs than physicians of other specialities.
- Physicians in larger and multi-specialty group practices were more likely to work with NPs, CNMs, or PAs than those in smaller and single-specialty group practices.
- Older physicians were less likely than middle-aged physicians to be in practices that had NPs, CNMs, or PAs.
- Physicians in practices with a higher proportion of revenue from Medicaid and a lower proportion from Medicare were more likely to work with NPs, CNMs, or PAs.
The expansion of health insurance coverage through health care reform, along with the aging of the population, are expected to strain the capacity for providing health care (1–3). Projections of the future physician workforce (4,5) predict declines in the supply of physicians and decreasing physician work hours (6,7) for primary care (8–10). An expansion of care delivered by nurse practitioners (NPs), certified nurse midwives (CNMs), and physician assistants (PAs) is often cited as a solution to the predicted surge in demand for health care services and calls for an examination of current reliance on these providers (11,12). Using a nationally based physician survey, we have described the employment of NPs, CNMs, and PAs among office-based physicians by selected physician and practice characteristics.
Keywords: National Ambulatory Medical Care Survey, office-based physicians, practice characteristics
Primary care physicians were more likely to work with NPs, CNMs, or PAs than physicians in other specialties.
- Overall, 49.1% of physicians in 2009 were in practices that had NPs, CNMs, or PAs (Figure 1).
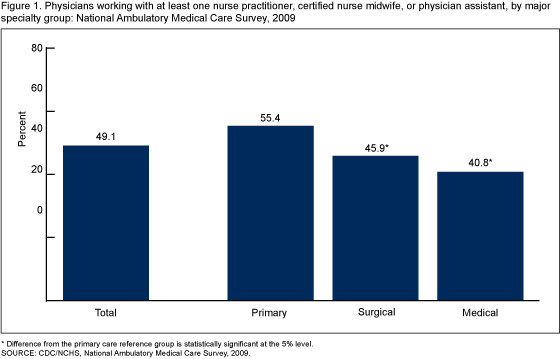
- In 2009, a higher percentage of primary care physicians (55.4%) had NPs, CNMs, or PAs associated with their practice than did surgical specialists (45.9%) and medical specialists (40.8%).
NPs, CNMs, or PAs were most likely to be associated with physicians who worked in large group practices.
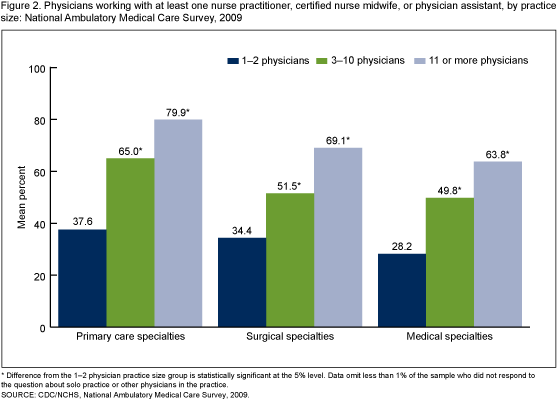
- Among all three specialty categories, physicians in larger practices were more likely to have NPs, CNMs, or PAs compared with those in smaller practices.
- Among primary care specialists, for example, 37.6% of physicians in practices with at most one other physician worked with NPs, CNMs, or PAs compared with 65.0% of those in practices with 3–10 physicians and 79.9% of those with at least 11 total physicians.
- Physicians in surgical and medical specialties followed this same pattern, with those in larger practices being more likely to have NPs, CNMs, or PAs (Figure 2).
Physicians in multi-specialty group practices were most likely to work with NPs, CNMs, or PAs.
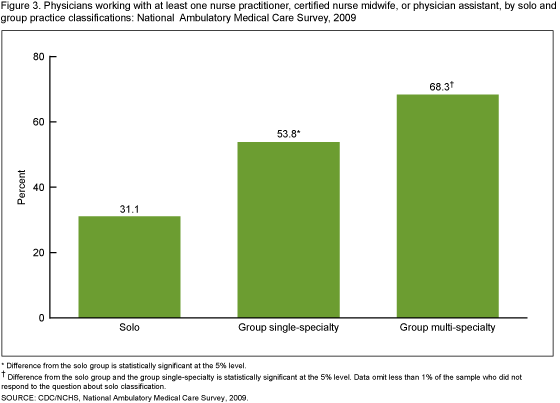
- Figure 3 shows that physicians in multi-specialty group practices were most likely to have NPs, CNMs, or PAs (68.3%) compared with those in single-specialty group practices (53.8%) and solo practices (31.1%).
- Comparing types of group practices, multi-specialty practices were more likely to have NPs, CNMs, or PAs (68.3%) compared with single-specialty practices (53.8%).
Older office-based physicians were less likely to work with NPs, CNMs, or PAs.
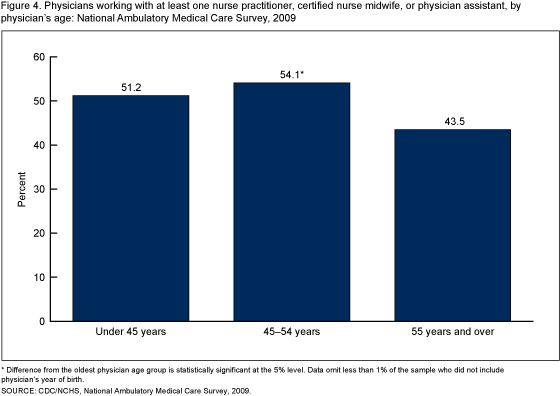
- Older physicians were less likely than middle-aged physicians to work with NPs, CNMs, or PAs (Figure 4).
- In 2009, 43.5% of physicians aged 55 and over were in practices with at least one NP, CNM, or PA compared with 54.1% of physicians aged 45–54.
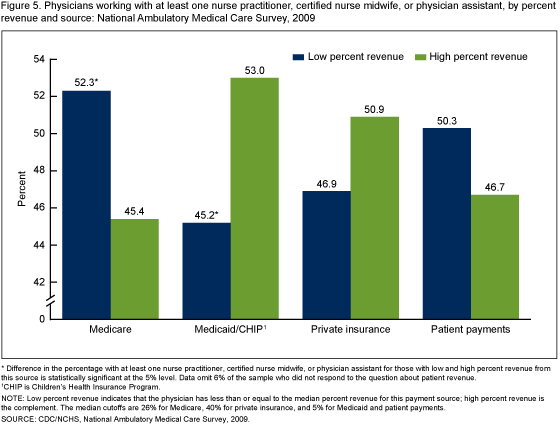
Physicians in practices with more revenue from Medicaid and less revenue from Medicare were more likely than others to work with NPs, CNMs, or PAs.
- Physicians in practices with more revenue from Medicare were less likely (45.4%) than those in practices with less revenue from Medicare (52.3%) to work with NPs, CNMs, or PAs (Figure 5).
- Conversely, physicians in practices with more revenue from Medicaid were more likely than those with less revenue from Medicaid to work with NPs, CNMs, or PAs (53% compared with 45.2%).
Summary
The expansion of health insurance coverage, as well as the aging baby-boomer population, are predicted to cause a surge in demand for health care services in the coming years. Examining the current employment of NPs, CNMs, and PAs in physician offices is important in order to prepare for the future. In 2009, 49% of physicians were in practices that worked with NPs, CNMs, or PAs. Physicians in primary care were more likely to work with NPs, CNMs, or PAs than physicians in other specialties. Physicians in large and multi-specialty group practices, compared with solo and single-specialty practices, were more likely to work with NPs, CNMs, or PAs. Older physicians were less likely than younger physicians to be in practices that had NPs, CNMs, or PAs. Physicians in practices with less revenue from Medicare and those with more revenue from Medicaid were more likely to work with NPs, CNMs, or PAs.
The role of NPs, CNMs, or PAs in the provision of health care is likely to increase in future years (12). The Patient Protection and Affordable Care Act legislation, signed into law on March 23, 2010, contains several provisions affecting the likely future supply of NPs, CNMs, and PAs (13). Specifically, these provisions include a 15% carve-out for PA educational programs in the funding for primary care medicine, making PA educational programs eligible for faculty loan repayment grants and grants for authorized nurse-midwifery education programs. Such incentives are likely to increase the supply of certain NPs, CNMs, and PAs. Increasing the supply of these practitioners may, in turn, affect the types of practices that use NPs, CNMs, or PAs.
Definitions
Percent revenue by source: Percentages of individual payment sources (i.e., Medicare, Medicaid, private insurance, or patient payments) that contribute to a physician’s overall practice revenue from patient care.
Physicians working with at least one nurse practitioner (NP), certified nurse midwife (CNM), or physician assistant (PA): The following question on the 2009 National Ambulatory Medical Care Survey (NAMCS) induction form was used to assess whether a physician had affiliated NPs, CNMs, or PAs at the location at which the physician saw the most patients: “How many mid-level providers (i.e., nurse practitioners, physician assistants, and nurse midwives) are associated with you at this in-scope location?”
Specialty type: NAMCS samples physicians in 14 American Medical Association (AMA) specialties and a miscellaneous specialty category. These specialties are grouped into three major categories: primary care, surgical, and medical, as shown in Figures 1 and 2. Major specialties included in the primary care grouping are internal medicine, family practice or general practice, pediatrics, and obstetrics and gynecology. Major specialties in the surgical category include general surgery, orthopedic surgery, urology, ophthalmology, and otolaryngology. Major specialties in the medical category are cardiovascular diseases, dermatology, psychiatry, and neurology. However, for analytic purposes, some subspecialties of pediatrics and obstetrics and gynecology are reclassified as medical or surgical. Less common specialties are also divided into these three groupings. For a complete description of all specialties and subspecialties included in the specialty type groupings, see the 2009 NAMCS Public-use Data File Documentation [PDF – 1.3 MB].
Data source and methods
Data from 2009 NAMCS were used for these analyses. NAMCS is a national probability sample survey of nonfederal, office-based physicians in the United States conducted by the Centers for Disease Control and Prevention’s (CDC) National Center for Health Statistics (NCHS), Division of Health Care Statistics. The target universe of NAMCS includes visits made in the United States to the offices of nonfederally employed physicians—excluding those in the specialties of anesthesiology, radiology, and pathology—who were classified by AMA and the American Osteopathic Association as providing “office-based, patient care.”
NAMCS utilizes a multistage probability sample design involving samples of geographic primary sampling units (PSUs), physician practices within PSUs, and patient visits within physician practices. PSUs are counties, groups of counties, county equivalents, or for some PSUs in New England, towns and townships. A sample weight is computed for each sample visit that takes all stages of design into account. The survey data are inflated or weighted to produce unbiased national annual estimates of physician office visits and unbiased annual estimates of physician characteristics, including attributes of their practices. Only physician-level statistics were utilized in this brief. Analysis was based on the sample of 1,592 physicians, after dropping 35 physicians missing information on employment of NPs, CNMs, or PAs.
The sampling approach for NAMCS excludes the collection of information about NPs, CNMs, and PAs with independent practices. In addition, information collected about visits to physicians in NAMCS does not routinely include information about visits to NPs, CNMs, or PAs except those in community health centers. Long-term trend analysis on the employment of NPs, CNMs, and PAs in physician offices is not possible with NAMCS because this information was not collected for all physicians until 2007.
Differences in the employment of NPs, CNMs, or PAs by physician practice characteristics were evaluated with two-tailed t tests using p < 0.05 as the level of significance. No corrections were made for multiple comparisons. All comparisons reported in the text are statistically significant. Data analyses were performed using the statistical packages SAS version 9.2 (SAS Institute, Cary, N.C.), SUDAAN version 10.0 (RTI International, Research Triangle Park, N.C.), and STATA version 11.0 (College Station, Texas).
About the authors
Melissa Park, Donald Cherry, and Sandra L. Decker are with the Centers for Disease Control and Prevention’s National Center for Health Statistics, Division of Health Care Statistics.
References
- CDC. Vital signs: Health insurance coverage and health care utilization—United States, 2006–2009 and January–March 2010. MMWR Morb Mortal Wkly Rep 59(44):1448–54. 2010.
- Iglehart J. Medicaid expansion offers solutions, challenges. Health Aff (Millwood) 29(2):230–2. 2010.
- Iglehart JK. Reform and the health care workforce—Current capacity, future demand. N Engl J Med 361(19):e38. 2009.
- Cooper RA, Getzen TE, McKee HJ, Laud P. Economic and demographic trends signal an impending physician shortage. Health Aff (Millwood) 21(1):140–54. 2002.
- Staiger DO, Auerbach DI, Buerhaus PI. Comparison of physician workforce estimates and supply projections. JAMA 302(15):1674–80. 2009.
- Shiotani LM, Parkerton PH, Wenger NS, Needleman J. Internal medicine work hours: Trends, associations, and implications for the future. Am J Med 121(1):80–5. 2008.
- Staiger DO, Auerbach DI, Buerhaus PI. Trends in the work hours of physicians in the United States. JAMA 303(8):747–53. 2010.
- Iglehart JK. Health reform, primary care, and graduate medical education. N Engl J Med 363(6):584–90. 2010.
- Bennett KL, Phillips JP. Finding, recruiting, and sustaining the future primary care physician workforce: A new theoretical model of specialty choice process. Acad Med 85(10 Suppl):S81–8. 2010.
- Wilson JF. Primary care delivery changes as nonphysician clinicians gain independence. Ann Intern Med 149(8):597–600. 2008.
- Morgan PA, Strand J, Ostbye T, Albanese MA. Missing in action: Care by physician assistants and nurse practitioners in national health surveys. Health Serv Res 42(5):2022–37. 2007.
- Cunningham R. Tapping the potential of the health care workforce: Scope-of-practice and payment policies for advanced practice nurses and physician assistants. National Health Policy Forum. Background Paper No. 76. 2010.
- The Patient Protection and Affordable Care Act, HR 3590, Subtitle F: Strengthening Primary Care and Other Workforce Improvements, Section 5501. Fed Regist 5:534–6. 2010.
Suggested citation
Park M, Cherry D, Decker SL. Nurse practitioners, certified nurse midwives, and physician assistants in physician offices. NCHS data brief, no 69. Hyattsville, MD: National Center for Health Statistics. 2011.
Copyright information
All material appearing in this report is in the public domain and may be reproduced or copied without permission; citation as to source, however, is appreciated.
National Center for Health Statistics
Edward J. Sondik, Ph.D., Director
Jennifer H. Madans, Ph.D., Associate Director for Science
Division of Health Care Statistics
Jane E. Sisk, Ph.D., Director
- Page last reviewed: November 6, 2015
- Page last updated: August 17, 2011
- Content source:


 ShareCompartir