1.0 Tutorial:
A step-by-step introduction to using WISQARS Nonfatal
WISQARS Nonfatal Navigation
- Help
- Nonfatal Injury Reports
- Leading Causes of Nonfatal Injury Reports
2.0 About Nonfatal Injury Reports:
An overview of nonfatal injury reports and the options offered3.0 About Leading Causes of Nonfatal Injury Reports:
An overview of leading causes of nonfatal injury reports and the options offered4.0 Definitions of Report Data Elements:
Thorough definitions of the data elements mentioned in the report request options and in the reports themselves5.0 Data Sources:
Further explanation of the purpose of and data sources for WISQARS Nonfatal and the process of compiling the data6.0 References:
References used within this help file.
 2.0
Nonfatal Injury
Reports - Overview
The request page for nonfatal injury reports allows you to request statistical tables by
- Cause (mechanism) of injury (such as falls, motor vehicle, fire/burn, cut/pierce, poisonings)
- Intent of injury (such as unintentional, assault, self-harm);
- Race / ethnicity (such as non-white Hispanic, black, Hispanic),
- Sex
- Disposition (where the injured person went after being released from the emergency department), and
- Year of reporting.
Also, for transportation-related injuries (e.g., motor vehicle occupant, motorcyclist, pedal cyclist, pedestrian, and other transport), you can select whether the injury occurred on a public road or highway (i.e., was traffic-related).
Under advanced options, you can
- Select reporting groups (e.g., age groups, disposition),
- Request age-adjusted rates by standard populations, and
- Define specific ages or age groupings of interest.
Because of the relatively high proportion of cases with unknown/unspecified race/ethnicity (approximately 17% of overall cases), WISQARS Nonfatal does not provide injury rates for selected race/ethnicity groups.
3.0 Leading Causes of Nonfatal Injury - Overview
 The
request page for leading causes of nonfatal injury reports
allows you to access charts of leading causes of
injury. One way to access a chart is to select one of
nine quick reports that display common leading causes of
nonfatal injury. These quick reports are located at
the top of the request page.
The other way to access a chart is to request a custom report. You can request up to 20 leading causes of nonfatal injuries by
- Sex,
- Race / ethnicity,
- Disposition (where the injured person went after release from the emergency department),
- Intent of injury (unintentional or violence-related), and
- Year of reporting.
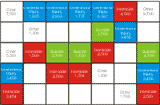
After you select a quick report or submit your custom request, WISQARS nonfatal displays a chart that ranks leading causes of nonfatal injuries by age groups and for all ages. Under advanced options for a customized report, you can select rankings of leading causes by single year of age or for a specific age group.
At the top of each column in the chart is a specific age group. By clicking on one of these age groups, you can obtain percentages and advanced statistics on the reliability of the national estimates provided within the chart.

