Mining Facts - 2010
Overall Mining
The Mine Safety and Health Administration (MSHA) maintains data collected under the Code of Federal Regulations (30 CFR Part 50) on accidents, fatal and nonfatal injuries, illnesses, employment, and coal production. Summary data were obtained from the MSHA data files for mine operators and independent contractors working on mine property. See Statistical Methodology for further information.
Mining Operations
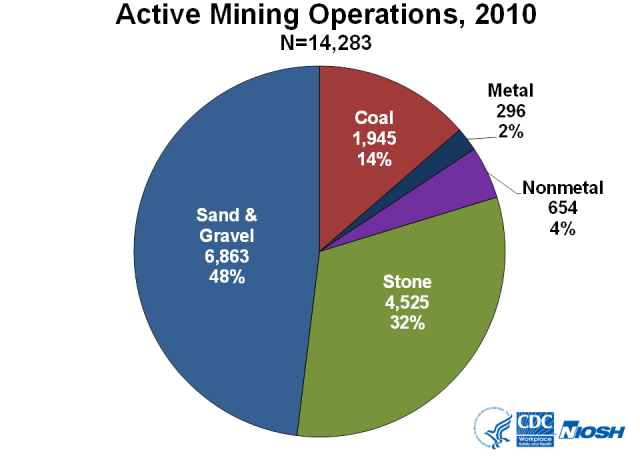
- In 2010, a total of 14,283 mining operations [1] reported employment data to MSHA.
- Almost half (48.1%) of the mines were sand & gravel mines, followed by stone mines (31.7%), coal mines (13.6%), nonmetal mines (4.6%), and metal mines (2.1%).
- Mines reporting to MSHA are located in all 50 states, Puerto Rico, and the Virgin Islands. Pennsylvania had the most mines (n=940; 6.6%) followed by Texas (n=705; 4.9%) and Kentucky (n=702; 4.9%). Almost half (49.1%) of the active mining operations are located in the 13 topmost states.
- The top primary commodities produced at mines were sand & gravel (n=6,863; 48.1%) followed by crushed and broken limestone (n=1,998; 14.0%) and bituminous coal (n=1,793; 12.6%).
Click on the image to enlarge.
Data for the previous chart showing the number of active mining operations and percent of total by commodity in 2010 (N=14,283)
| Commodity | Number of Mines | Percent of Total |
|---|---|---|
| Coal | 1,945 | 14 |
| Metal | 296 | 2 |
| Nonmetal | 654 | 4 |
| Stone | 4,525 | 32 |
| Sand & Gravel | 6,863 | 48 |
Independent Contracting Companies
- An independent contractor is defined by MSHA as “any person, partnership, corporation, subsidiary of a corporation, firm, association or other organization that contracts to perform services or construction at a mine.” Contractors that perform specific types of work are required to report the number of employees who work at coal mines and noncoal mines.
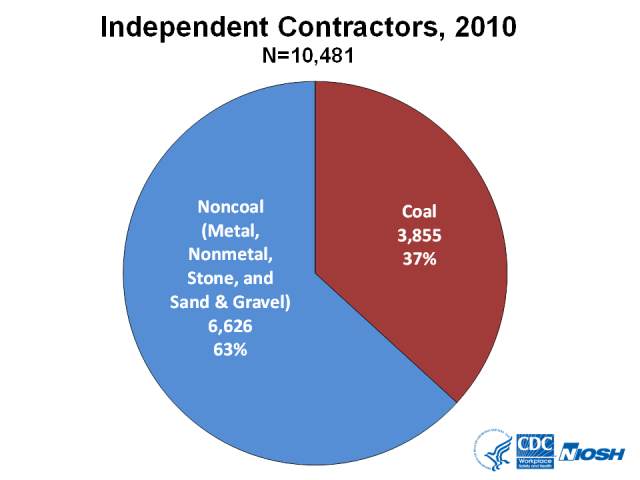
- In 2010, a total of 10,481 independent contractors reported employment data to MSHA.
- There were 3,855 (36.8%) contracting companies working at coal mines and 6,626 (63.2%) contracting companies working at noncoal (metal, nonmetal, stone, and sand & gravel) mines.
Click on the image to enlarge.
Data for the previous chart showing the number of independent contracting companies and percent of total by commodity in 2010 (N=10,481)
| Commodity | Number of Companies | Percent of Total |
|---|---|---|
| Coal | 3,855 | 37 |
| Noncoal (Metal, Nonmetal, Stone, and Sand & Gravel) | 6,626 | 63 |
Employees
- There were 249,355 mine operator employees, [2] or 247,587 full-time equivalent (FTE) [3] workers.
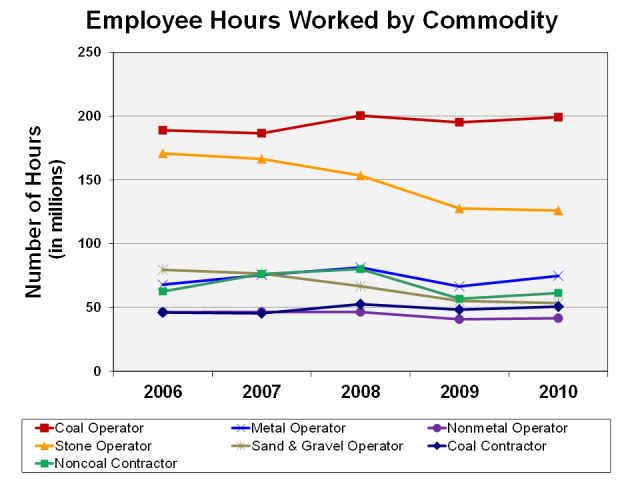
- Within the mining commodities, [4] coal operators reported the most employees (n=89,209; 24.7%), followed by stone operators (n=67,612; 18.7%), noncoal contractors (n=65,497; 18.1%), coal contractors (n=46,324; 12.8%), sand & gravel operators (n=35,993; 10.0%), metal operators (n=35,903; 9.9%) and nonmetal operators (n=20,638; 5.7%).
- For mine operators, 23.1% of the employee hours were for underground work locations, and 76.9% of the employee hours were for surface work locations. [5]
- Of the 111,821 independent contractor employees (or 56,043 FTE workers), 41.4% were coal contractor employees and 58.6% were noncoal (metal, nonmetal, stone, and sand & gravel) contractor employees
Click on the image to enlarge.
Data for the previous chart showing the average number of employee hours (in millions) worked by commodity and year, 2006-2010
| Commodity | 2006 | 2007 | 2008 | 2009 | 2010 |
|---|---|---|---|---|---|
| Coal Operator | 189.0 | 186.5 | 200.4 | 195.2 | 199.2 |
| Metal Operator | 67.9 | 75.5 | 81.4 | 66.5 | 74.8 |
| Nonmetal Operator | 46.4 | 46.5 | 46.5 | 40.8 | 41.6 |
| Stone Operator | 170.8 | 166.5 | 153.5 | 127.7 | 126.0 |
| Sand & Gravel Operator | 79.6 | 76.7 | 66.7 | 55.2 | 53.5 |
| Coal Contractor | 46.2 | 45.5 | 52.6 | 48.3 | 50.7 |
| Noncoal Contractor | 62.6 | 76.3 | 80.2 | 56.9 | 61.4 |
Occupational Fatalities
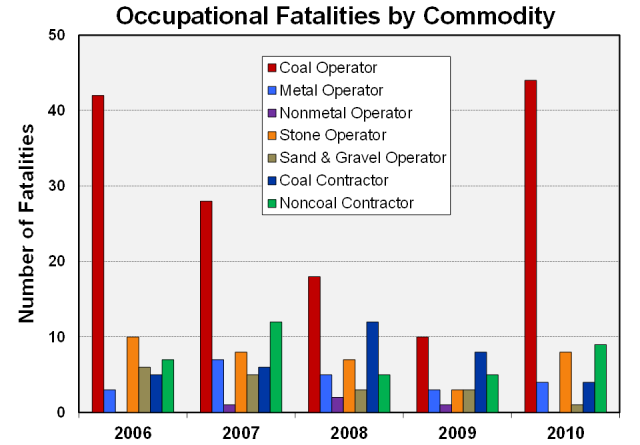
- In 2010, there were 70 occupational mining fatalities with a rate of 25.4 [95% confidence interval (CI): 19.8, 32.1] per 100,000 FTE workers. This compares to 33 fatalities with a rate of 12.3 [CI: 8.5, 17.3] in 2009.
- The fatality rate for mine operator employees was 25.5 [CI: 19.3, 33.1] (n=57; 81.4%), and the rate for contractor employees was 24.7 [CI: 13.2, 42.3] (n=13; 18.6%).
- Coal operators had the highest fatality rate of 45.9 [CI: 33.4, 61.7] (n=44; 62.9%), followed by noncoal contractors at 31.4 [CI: 14.3, 59.6] (n=9; 12.9%) and stone operators at 14.9 [CI: 6.4, 29.3] (n=8; 11.4%).
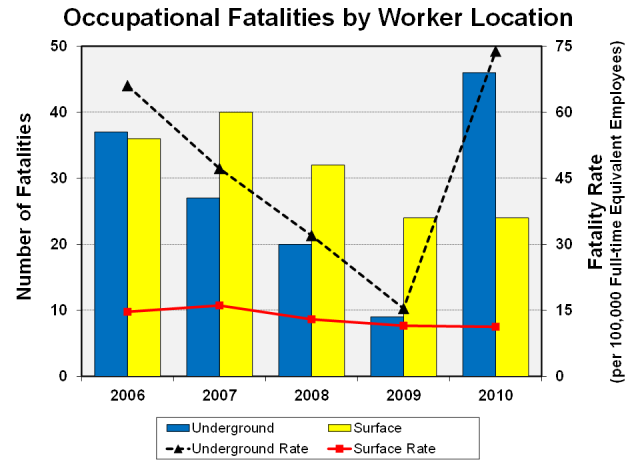
- The fatality rate at underground work locations was 73.9 [CI: 54.1, 98.5] per 100,000 FTE workers (n=46; 65.7%) compared to 11.2 [CI: 7.2, 16.7] (n=24; 34.3%) at surface work locations.
Click on the image to enlarge.
Data for the previous chart showing the number of occupational fatalities by commodity and year, 2006-2010 (excludes office employees)
| Commodity | 2006 | 2007 | 2008 | 2009 | 2010 |
|---|---|---|---|---|---|
| Coal Operator | 42 | 28 | 18 | 10 | 44 |
| Metal Operator | 3 | 7 | 5 | 3 | 4 |
| Nonmetal Operator | 0 | 1 | 2 | 1 | 0 |
| Stone Operator | 10 | 8 | 7 | 3 | 8 |
| Sand & Gravel Operator | 6 | 5 | 3 | 3 | 1 |
| Coal Contractor | 5 | 6 | 12 | 8 | 4 |
| Noncoal Contractor | 7 | 12 | 5 | 5 | 9 |
Nonfatal Lost-time Injuries
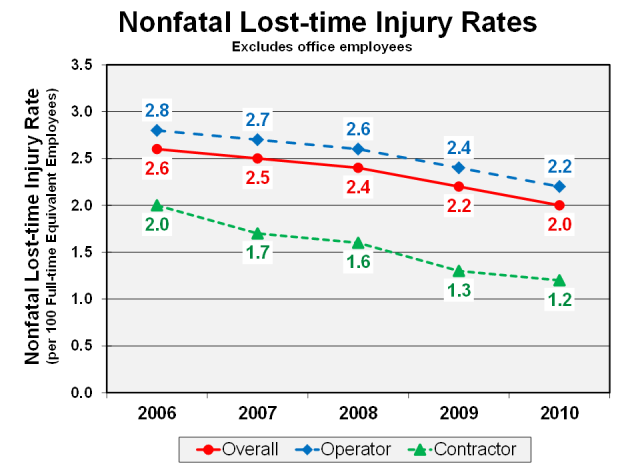
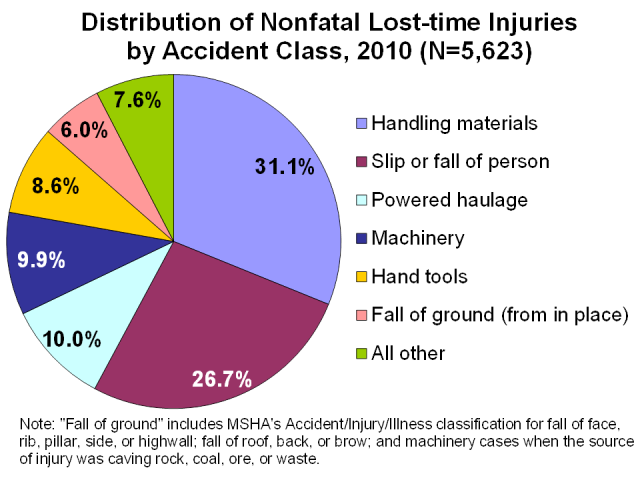
- There were 5,623 nonfatal lost-time injuries in 2010 (2,243 at underground and 3,380 at surface work locations). These injuries occurred at an overall rate of 2.0 [CI: 2.0, 2.1] per 100 FTE workers and resulted in a total of 342,914 days lost from work. [6]
- The underground nonfatal lost-time injury rate was greater than the surface injury rate (3.6 [CI: 3.5, 3.8] vs. 1.6 [CI: 1.5, 1.6] per 100 FTE workers).
Click on the image to enlarge.
Data for the previous chart showing the overall, operator, and contractor nonfatal lost-time injury rate (per 100 full-time equivalent employees) by year, 2006-2010 (excludes office employees)
| Year | Overall | Operator | Contractor |
|---|---|---|---|
| 2006 | 2.6 | 2.8 | 2.0 |
| 2007 | 2.5 | 2.7 | 1.7 |
| 2008 | 2.4 | 2.6 | 1.6 |
| 2009 | 2.2 | 2.4 | 1.3 |
| 2010 | 2.0 | 2.2 | 1.2 |
- The back was the most frequently reported body part injured, accounting for 958 nonfatal lost-time injuries, 69,635 days lost from work, and 20.3% of all days lost.
- Sprains or strains was the most frequently reported nature of injury (n=2,477; 44.1%).
Click on the image to enlarge.
Data for the previous chart showing the distribution of nonfatal lost-time injuries by accident class, 2010 (N=5,623)
| Accident Class | Percent |
|---|---|
| Handling materials | 31.1 |
| Slip or fall of person | 26.7 |
| Powered haulage | 10.0 |
| Machinery | 9.9 |
| Hand tools | 8.6 |
| Fall of ground (from in place) | 6.0 |
| All other | 7.6 |
Underground and Surface Mining
Mining Operations
- Data obtained from MSHA indicated a total of 819 underground (5.7%) and 13,464 surface (94.3%) mining operations.
- The commodity with the highest number of active mines was sand & gravel (n=6,863). All sand & gravel mining is performed at surface work locations.
Employees
- A total of 59,055 employees, or 62,288 FTE employees, were reported to MSHA as working at underground mining locations in 2010. This is in contrast to 302,121 employees (or 241,343 FTE employees) who were reported as working at surface locations.
- Surface work location employee hours accounted for 79.5% of all hours reported to MSHA, and 20.5% of employee hours were reported for underground work locations.
- The majority of surface employee hours were for mine operator employees (78.9%) as opposed to independent contractor employees (21.1%).
- The coal operator mining sector reported the most underground worker employee hours to MSHA (n=94,798,258; 76.1%).
Occupational Fatalities
- Of the 70 occupational mining fatalities reported to MSHA in 2010, 46 occurred at underground work locations, and 24 occurred at surface locations.
- The rate of fatalities at underground work locations was 73.9 [95% confidence interval (CI): 54.1, 98.5] per 100,000 FTE employees. This compares to the lower fatality rate at surface work locations of 11.2 [CI: 7.2, 16.7].
Click on the image to enlarge.
Data for the previous chart showing the number and rate (per 100,000 full-time equivalent employees) of occupational fatalities by worker location and year, 2006-2010 (excludes office employees)
| Year | Underground Number | Underground Rate | Surface Number | Surface Rate |
|---|---|---|---|---|
| 2006 | 37 | 66.0 | 36 | 14.6 |
| 2007 | 27 | 47.2 | 40 | 16.1 |
| 2008 | 20 | 32.0 | 32 | 12.9 |
| 2009 | 9 | 15.4 | 24 | 11.5 |
| 2010 | 46 | 73.9 | 24 | 11.2 |
Nonfatal Lost-time Injuries
- Within underground work locations, 2,243 nonfatal lost-time injuries were reported, resulting in 148,592 days lost from work. This compares to 3,380 nonfatal lost-time injuries attributed to surface workers resulting in 194,322 days lost from work.
- The overall underground nonfatal lost-time injury rate was greater than the surface injury rate (3.6 [CI: 3.5, 3.8] vs. 1.6 [CI: 1.5, 1.6] per 100 FTE workers).
- The most frequent classification of nonfatal lost-time injuries involved handling materials for both underground (n=643; 28.7%) and surface (n=1,108; 32.8%) work locations.
- The back was the most frequently reported body part injured at both underground (n=357; 15.9%) and surface (n=601; 17.8%) work locations.
Coal and Metal/Nonmetal Mining
Mining Operations
- Data obtained from MSHA indicated 1,945 active coal (13.6%) and 12,338 metal/nonmetal (86.4%) mining operations.
- There were 26 states reporting coal mining operations. Approximately 72% of these mines were located in three states: Kentucky (n=569; 29.3%), West Virginia (n=418; 21.5%), and Pennsylvania (n=409; 21.0%).
- Metal/nonmetal mines were distributed across all states, Puerto Rico, and the Virgin Islands. Texas reported the most metal/nonmetal mines (n=691, 5.6%).
Employees
- A total of 135,533 mine operator and independent contractor employees (or 124,939 FTE employees) were reported to MSHA as working at coal mines.
- Metal/nonmetal mines reported a total of 225,643 employees (or 178,692 employees).
Occupational Fatalities
- Of the 70 occupational mining fatalities reported to MSHA in 2010, 48 occurred at coal mining operations, and 22 occurred at metal/nonmetal mines.
- The fatality rate of 40.1 [CI: 29.6, 53.2] per 100,000 FTE employees was higher at coal mining operations, compared to the rate of 14.1 [CI: 8.8, 21.3] for metal/nonmetal mines.
Nonfatal Lost-time Injuries
- There were 2,849 nonfatal lost-time injuries reported at coal mining operations, resulting in 189,938 days lost from work. This compares to 2,774 nonfatal lost-time injuries attributed to metal/nonmetal mine workers with 152,976 days lost from work.
- The coal mine nonfatal lost-time injury rate was greater than the metal/nonmetal mine rate (2.4 [CI: 2.3, 2.5] vs. 1.8 [CI: 1.7, 1.8] per 100 FTE workers).
- The most frequent accident classification of nonfatal lost-time injuries involved handling materials for both coal (n=788; 27.7%) and metal/nonmetal mines (n=963; 34.7%).
- Sprains or strains was the most frequently reported nature of injury for both coal (n=1,256; 44.1%) and metal/nonmetal (n=1,221; 44.0%) mining operations.
Coal Mine Operators
Mining Operations
- In 2010, a total of 1,945 coal mining operations reported employment MSHA. Coal mines comprised 13.6% of all mining operations.
- Bituminous mines comprised 92.2% (n=1,793) and anthracite mines 7.8% (n=152) of coal mining operations.
- Approximately 72% of all coal mines were located in three states: Kentucky (n=569; 29.3%), West Virginia (n=418; 21.5%), and Pennsylvania (n=409; 21.0%).
Employees
- A total of 89,209 employees, corresponding to 99,583 FTE employees, were reported by coal mine operators to MSHA.
- Within the mining sectors, coal operators comprised 32.8% of all employee hours reported.
- Underground work locations accounted for 47.6% of employee hours, and surface work locations accounted for 52.4%.
Occupational Fatalities
- In 2010, 44 occupational fatalities occurred among coal mine operator employees, compared to 10 in 2009.
- Fatalities among coal operator employees accounted for 62.9% of all mining fatalities.
- The coal operator fatality rate was 45.9 [CI: 33.4, 61.7] fatalities per 100,000 FTE employees. The underground fatality rate was 84.4 [CI: 60.3, 114.9] (n=40). There were 4 fatalities reported at surface work locations (no rate is calculated when the number is less than 5).
Nonfatal Lost-time Injuries
- There were 2,488 nonfatal lost-time injuries (1,818 at underground and 670 at surface work locations) among coal operator employees, occurring at an overall rate of 2.6 [CI: 2.5, 2.7] injuries per 100 FTE employees. These injuries resulted in 168,160 days lost from work, comprising 49.0% of days lost across all mining sectors.
- The underground nonfatal lost-time injury rate of 3.8 [CI: 3.7, 4.0] was greater than the surface injury rate of 1.4 [CI: 1.3, 1.5] per 100 FTE workers.
- The most frequent classification of nonfatal lost-time injuries for coal operator employees involved handling materials (n=691; 27.8%).
- Sprains or strains was the most frequently reported nature of injury (n=1,117; 44.9%).
- The back was the most frequently reported body part injured (n=448; 18.0%) and accounted for 43,981 days lost from work.
Metal Mine Operators
Mining Operations
- In 2010, a total of 296 metal mining operations reported employment MSHA. Metal mines were the smallest mining sector, comprising 2.1% of all mining operations.
- Gold mines comprised 51.0% (n=151) of all metal mining operations. Other common types of metal mines were copper ore (n=35; 11.8%) and iron ore (n=33; 11.1%).
- Nevada had the largest number of metal mines (n=54; 18.2%), followed by Alaska (n=34; 11.5%).
Employees
- A total of 35,903 employees, corresponding to 37,424 FTE employees, were reported by metal mine operators.
- Within the mining sectors, metal mine operator employees accounted for 12.3% of all employee hours reported to MSHA.
- Metal operator employee hours were reported for both underground (14.1%) and surface (85.9%) work locations.
Occupational Fatalities
- Four occupational fatalities occurred among metal mine operator employees in 2010. This compares to three occupational fatalities in 2009.
- Of these reported fatalities, three occurred at an underground work location, and one fatality occurred at a surface work location.
Nonfatal Lost-time Injuries
- There were 604 nonfatal lost-time injuries (165 at underground and 439 at surface work locations) among metal operator employees occurring at an overall rate of 1.8 [CI: 1.7, 2.0] injuries per 100 FTE employees. A total of 29,400 days lost from work resulted from these injuries.
- The underground nonfatal lost-time injury rate was greater than the surface injury rate (3.1 [CI: 2.6, 3.6] vs. 1.6 [CI: 1.4, 1.7] per 100 FTE workers).
- The most frequent classification of nonfatal lost-time injuries involved handling materials (n=198; 32.8%), followed by slip or fall of person (n=150; 24.8%).
- Sprains or strains was the most frequently reported nature of injury (n=279; 46.2%).
- The back was the most frequently reported body part injured (n=97; 16.1%) and accounted for 5,035 days lost from work.
Nonmetal Mine Operators
Mining Operations
- In 2010, a total of 654 nonmetal mining operations reported employment MSHA. Nonmetal mines comprised 4.6% of all mining operations.
- Mines producing clay (common) comprised 21.3% (n=139) of all nonmetal mining operations. This was followed by 88 nonmetal mines producing clay, ceramic, and refractory that are not elsewhere classified (13.5%).
- The states with the most nonmetal mining operations were Texas (n=54; 8.3%) and Georgia (n=52; 8.0%).
- Approximately 50% of the active nonmetal mining operations were located in the 9 topmost states of Texas, Georgia, California, North Carolina, Wyoming, Nevada, New Mexico, Florida, and Utah.
Employees
- A total of 20,638 employees, corresponding to 20,804 FTE employees, were reported to MSHA by nonmetal mine operators.
- Within the mining sectors, nonmetal mine operator employees accounted for 6.9% of all employee hours reported.
- Employee hours were reported at underground (12.4%) and surface (87.6%) work locations.
Occupational Fatalities
-
There were no occupational fatalities among nonmetal mine operators in 2010. This compares to one fatality reported in 2009.
Nonfatal Lost-time Injuries
- There were 334 nonfatal lost-time injuries (70 at underground and 264 at surface work locations) among nonmetal mine operator employees.
- Nonfatal lost-time injuries occurred at an overall rate of 1.9 [CI: 1.7, 2.1] per 100 FTE employees.
- A total of 18,127 days lost from work resulted from these nonmetal mine operator injuries.
- The underground nonfatal lost-time injury rate was greater than the surface injury rate (2.7 [CI: 2.1, 3.4] vs. 1.7 [CI: 1.5, 2.0] per 100 FTE workers).
- In 2010, the most frequent classification of nonfatal lost-time injuries involved handling materials (n=131; 39.2%), followed by slip or fall of person (n=84; 25.1%).
- Sprains or strains was the most frequently reported nature of injury (n=158; 47.3%), followed by fractures or chips (n=39; 11.7%), cuts, lacerations or punctures (n=33; 9.9%), and contusions or bruises (n=26; 7.8%).
- The back was the most frequently reported body part injured (n=56; 16.8%) and accounted for 2,543 days lost from work. This was followed by fingers (n=43; 12.9%) and the knee (n=39; 11.7%).
Stone Mine Operators
Mining Operations
- In 2010, a total of 4,525 stone mining operations reported employment to MSHA. Stone mines comprised 31.7% of all mining operations.
- Mines producing the primary commodity of limestone (crushed and broken) comprised the largest number of operations (n=1,998; 44.2%).
- Stone mining operations were located in all states and territories except Delaware.
- Pennsylvania had the most stone mines (n=416; 9.2%), followed by Texas (n=354; 7.8%).
Employees
- A total of 67,612 employees, corresponding to 63,021 FTE employees, were reported to MSHA by stone mine operators.
- Within the mining sectors, stone mine operator employees accounted for 20.8% of all employee hours reported.
- Stone operator employee hours were reported for both underground (2.9%) and surface (97.1%) work locations.
Occupational Fatalities
- There were eight occupational fatalities reported among stone mine operator employees in 2010, compared to three in 2009.
- All fatalities occurred at surface areas of the mines.
- Four of the eight fatalities had an accident classification of powered haulage.
Nonfatal Lost-time Injuries
- There were 1,171 nonfatal lost-time injuries (41 at underground and 1,130 at surface work locations) among stone operator employees.
- The overall injury rate was 2.2 [CI: 2.1, 2.3] injuries per 100 FTE employees.
- A total of 60,585 days lost from work resulted from these injuries, comprising 17.7% of days lost across all sectors.
- The nonfatal lost-time injury rate was 2.2 [CI: 1.6, 3.0] for underground and 2.2 [CI: 2.1, 2.3] per 100 FTE for surface work locations.
- The most frequent classification of nonfatal lost-time injuries for stone operator employees involved handling materials (n=409; 34.9%).
- Sprains or strains was the most frequently reported nature of injury (n=549; 46.9%).
- The back was the most frequently reported body part injured (n=206, 17.6%) and accounted for 8,847 days lost from work.
Sand & Gravel Mine Operators
Mining Operations
- In 2010, a total of 6,863 sand and gravel mining operations reported employment to MSHA.
- Sand and gravel mines were the largest mining sector, comprising 48.1% of all mining operations.
- Sand and gravel mines were found throughout all 50 states and Puerto Rico.
- Minnesota had the largest number of sand and gravel mines (n=488; 7.1%).
Employees
- A total of 35,993 employees, corresponding to 26,754 FTE employees, were reported by sand and gravel mine operators.
- Within the mining sectors, sand and gravel mine operator employees accounted for 8.8% of all employee hours reported to MSHA.
- All sand and gravel operator hours reported were for surface work locations.
- The total number of hours reported for mine operator employees working at sand and gravel mining operations was 53,508,979.
Occupational Fatalities
-
One occupational fatality occurred among sand and gravel operator employees in 2010. This compared to three fatalities in 2009.
Nonfatal Lost-time Injuries
- There were 412 nonfatal lost-time injuries among sand and gravel operator employees occurring at a rate of 1.8 [CI: 1.6, 2.0] injuries per 100 FTE employees.
- A total of 26,829 days lost from work resulted from these injuries.
- The most frequent classifications of nonfatal lost-time injuries for sand and gravel operator employees involved handling materials (n=134; 32.5%) and slip or fall of person (n=121; 29.4%).
- Sprains or strains was the most frequently reported nature of injury (n=148; 35.9%), followed by cuts, lacerations, or punctures (n=72; 17.5%).
- The fingers were the most frequently reported body part injured (n=62; 15.0%). These injuries resulted in 1,894 days lost from work.
Coal Contractors
Independent Contracting Companies
-
In 2010, a total of 3,855 independent contracting companies reported employment at coal mines, or 36.8% of all independent contracting companies.
Employees
- A total of 46,324 employees, corresponding to 25,355 FTE employees, were reported by coal contractors.
- Within the mining sectors, coal contractor employees comprised 8.4% of all employee hours.
- Coal contractor employee hours were reported for both underground (14.2%) and surface (85.8%) work locations.
Occupational Fatalities
- Four occupational fatalities occurred among coal contractor employees in 2010. These coal fatalities accounted for 30.8% of all fatalities attributed to independent contractors.
- The coal contractor fatality rate was not calculated because the number of fatalities was less than 5 (n=4).
Nonfatal Lost-time Injuries
- There were 361 nonfatal lost-time injuries among coal contractor employees (121 at underground and 240 at surface work locations).
- The overall injury rate was 1.5 [CI: 1.4, 1.7] per 100 FTE employees. These injuries resulted in 21,778 days lost from work.
- The underground nonfatal lost-time injury rate was greater than the surface injury rate (3.4 [CI: 2.8, 3.9) vs. 1.2 [CI: 1.0, 1.3] per 100 FTE workers).
- The most frequent classification of nonfatal lost-time injuries involved slip or fall of person (n=126; 34.9%), followed by handling materials (n=97; 26.9%).
- Sprains or strains was the most frequently reported nature of injury (n=139; 38.5%).
- The back was the most frequently reported body part injured (n=59; 16.3%) and accounted for 4,169 days lost from work.
Noncoal Contractors
Independent Contracting Companies
-
In 2010, a total of 6,626 independent contracting companies reported employment at noncoal (metal, nonmetal, stone, and sand & gravel) mines, or 63.2% of all independent contracting companies.
Employees
- A total of 65,497 employees, corresponding to 30,688 FTE employees, were reported by noncoal contractors.
- Within the mining sectors, noncoal contractor employees comprised 10.1% of all employee hours.
- Noncoal contractor employee hours were reported for both underground (5.2%) and surface (94.8%) work locations.
Occupational Fatalities
- Nine occupational fatalities occurred among noncoal contractor employees in 2010, accounting for 69.2% of all fatalities attributed to independent contractors.
- Seven of the noncoal contractor fatalities occurred at surface and 2 fatalities occurred at underground work locations.
- The noncoal contractor fatality rate for all work locations was 31.4 [CI: 14.3, 59.6] fatalities per 100,000 FTE employees.
Nonfatal Lost-time Injuries
- There were 253 nonfatal lost-time injuries among noncoal contractor employees (28 at underground and 225 at surface work locations) with an overall rate of 0.9 [CI: 0.8, 1.0] injuries per 100 FTE employees.
- These injuries resulted in 18,035 total days lost from work.
- The underground nonfatal lost-time injury rate was 1.8 [CI: 1.2, 2.6] and the surface rate was 0.8 [CI: 0.7, 0.9] per 100 FTE workers.
- The most frequent classification of nonfatal lost-time injuries involved handling materials (n=91; 36.0%), followed by slip or fall of person (n=70; 27.7%).
- Sprains or strains was the most frequently reported nature of injury (n=87; 34.4%) for noncoal contractor employees.
- The most frequently reported body part injured was the fingers (n=50; 19.8%) These injuries resulted in 3,083 days lost from work.
Notes
Publicly released employment and accident/injury/illness data collected by the Mine Safety and Health Administration (MSHA) under the Code of Federal Regulations (30 CFR 50). All analyses of accident data exclude office employees. Occupational fatalities exclude all cases under 17 years of age. Caution should be used when interpreting rates based on a small number of events.
[1] Both mine operator and independent contractor employees work at mining operations. Active mines are those that report any mine operator employment. Mines at which only independent contractors were working and did not show any operator employment were not counted.
[2] Average number of employees working at individual mines during calendar quarters of active operations (includes office workers).
[3] Full-time equivalent employees computed using reported employee hours (2,000 hours = 1 FTE; includes office workers).
[4] Mining commodity and type of employer classes include coal operators, metal operators, nonmetal operators, stone operators, sand & gravel operators, coal contractors, and noncoal (metal, nonmetal, stone, and sand & gravel) contractors.
[5] Surface work locations include surface operations at underground mines, surface operations (strip or open pit), dredge, other surface operations, independent shops and yards, and mills or preparation plants.
[6] Total days lost includes actual days away from work and/or days of restricted work activity. For permanently disabling injuries only, statutory days charged by MSHA were used if they exceeded the total lost workdays.
Data Tables
Active Mining Operations, 2010
| Commodity | Underground | Surface | Total |
|---|---|---|---|
| Coal | 570 | 1,375 | 1,945 |
| Metal | 97 | 199 | 296 |
| Nonmetal | 41 | 613 | 654 |
| Stone | 111 | 4,414 | 4,525 |
| Sand & Gravel | 0 | 6,863 | 6,863 |
| TOTAL | 819 | 13,464 | 14,283 |
Employment Characteristics, 2010
| Commodity and Type of Employer | Underground Employees | Surface Employees | Total Employees | Underground FTE Employees | Surface FTE Employees | Total FTE Employees |
|---|---|---|---|---|---|---|
| Coal Operator | 41,460 | 47,749 | 89,209 | 47,399 | 52,184 | 99,583 |
| Metal Operator | 5,124 | 30,779 | 35,903 | 5,284 | 32,140 | 37,424 |
| Nonmetal Operator | 2,456 | 18,182 | 20,638 | 2,571 | 18,233 | 20,804 |
| Stone Operator | 1,748 | 65,864 | 67,612 | 1,840 | 61,181 | 63,021 |
| Sand & Gravel Operator | 0 | 35,993 | 35,993 | 0 | 26,754 | 26,754 |
| Operator Total | 50,788 | 198,567 | 249,355 | 57,094 | 190,493 | 247,587 |
| Coal Contractor | 5,784 | 40,540 | 46,324 | 3,610 | 21,745 | 25,355 |
| Noncoal Contractor | 2,483 | 63,014 | 65,497 | 1,584 | 29,104 | 30,688 |
| Contractor Total | 8,267 | 103,554 | 111,821 | 5,194 | 50,850 | 56,043 |
| TOTAL | 59,055 | 302,121 | 361,176 | 62,288 | 241,343 | 303,630 |
Note: Components may not sum to totals due to rounding
Occupational Fatalities, 2010
Rate per 100,000 full-time equivalent employees; 95% confidence interval
| Commodity and Type of Employer | Total Number | Total Rate | Total Lower CI | Total Upper CI |
|---|---|---|---|---|
| Coal Operator | 44 | 45.9 | 33.4 | 61.7 |
| Metal Operator | 4 | NC | NC | NC |
| Nonmetal Operator | 0 | NC | NC | NC |
| Stone Operator | 8 | 14.9 | 6.4 | 29.3 |
| Sand & Gravel Operator | 1 | NC | NC | NC |
| Operator Total | 57 | 25.5 | 19.3 | 33.1 |
| Coal Contractor | 4 | NC | NC | NC |
| Noncoal Contractor | 9 | 31.4 | 14.3 | 59.6 |
| Contractor Total | 13 | 24.7 | 13.2 | 42.3 |
| TOTAL | 70 | 25.4 | 19.8 | 32.1 |
Note: NC–Not calculated when N is less than 5
Occupational Fatalities (Underground), 2010
Rate per 100,000 full-time equivalent employees; 95% confidence interval
| Commodity and Type of Employer | Underground Number | Underground Rate | Underground Lower CI | Underground Upper CI |
|---|---|---|---|---|
| Coal Operator | 40 | 84.4 | 60.3 | 114.9 |
| Metal Operator | 3 | NC | NC | NC |
| Nonmetal Operator | 0 | NC | NC | NC |
| Stone Operator | 0 | NC | NC | NC |
| Sand & Gravel Operator | NA | NA | NA | NA |
| Operator Total | 43 | 75.3 | 54.5 | 101.4 |
| Coal Contractor | 1 | NC | NC | NC |
| Noncoal Contractor | 2 | NC | NC | NC |
| Contractor Total | 3 | NC | NC | NC |
| TOTAL | 46 | 73.9 | 54.1 | 98.5 |
Notes: NA–Not applicable; NC–Not calculated when N is less than 5
<
Occupational Fatalities (Surface), 2010
Rate per 100,000 full-time equivalent employees; 95% confidence interval
| Commodity and Type of Employer | Surface Number | Surface Rate | Surface Lower CI | Surface Upper CI |
|---|---|---|---|---|
| Coal Operator | 4 | NC | NC | NC |
| Metal Operator | 1 | NC | NC | NC |
| Nonmetal Operator | 0 | NC | NC | NC |
| Stone Operator | 8 | 15.4 | 6.7 | 30.4 |
| Sand & Gravel Operator | 1 | NC | NC | NC |
| Operator Total | 14 | 8.4 | 4.6 | 14.1 |
| Coal Contractor | 3 | NC | NC | NC |
| Noncoal Contractor | 7 | 25.8 | 10.4 | 53.2 |
| Contractor Total | 10 | 21.1 | 10.1 | 38.8 |
| TOTAL | 24 | 11.2 | 7.2 | 16.7 |
Note: NC–Not calculated when N is less than 5
Nonfatal Lost-time Injuries, 2010
Rate per 100 full-time equivalent employees; 95% confidence interval
| Commodity and Type of Employer | Total Number | Total Rate | Total Lower CI | Total Upper CI |
|---|---|---|---|---|
| Coal Operator | 2,488 | 2.6 | 2.5 | 2.7 |
| Metal Operator | 604 | 1.8 | 1.7 | 2.0 |
| Nonmetal Operator | 334 | 1.9 | 1.7 | 2.1 |
| Stone Operator | 1,171 | 2.2 | 2.1 | 2.3 |
| Sand & Gravel Operator | 412 | 1.8 | 1.6 | 2.0 |
| Operator Total | 5,009 | 2.2 | 2.2 | 2.3 |
| Coal Contractor | 361 | 1.5 | 1.4 | 1.7 |
| Noncoal Contractor | 253 | 0.9 | 0.8 | 1.0 |
| Contractor Total | 614 | 1.2 | 1.1 | 1.3 |
| TOTAL | 5,623 | 2.0 | 2.0 | 2.1 |
Nonfatal Lost-time Injuries (Underground), 2010
Rate per 100 full-time equivalent employees; 95% confidence interval
| Commodity and Type of Employer | Underground Number | Underground Rate | Underground Lower CI | Underground Upper CI |
|---|---|---|---|---|
| Coal Operator | 1,818 | 3.8 | 3.7 | 4.0 |
| Metal Operator | 165 | 3.1 | 2.6 | 3.6 |
| Nonmetal Operator | 70 | 2.7 | 2.1 | 3.4 |
| Stone Operator | 41 | 2.2 | 1.6 | 3.0 |
| Sand & Gravel Operator | NA | NA | NA | NA |
| Operator Total | 2,094 | 3.7 | 3.5 | 3.8 |
| Coal Contractor | 121 | 3.4 | 2.8 | 3.9 |
| Noncoal Contractor | 28 | 1.8 | 1.2 | 2.6 |
| Contractor Total | 149 | 2.9 | 2.4 | 3.3 |
| TOTAL | 2,243 | 3.6 | 3.5 | 3.8 |
Note: NA–Not applicable
Nonfatal Lost-time Injuries (Surface), 2010
Rate per 100 full-time equivalent employees; 95% confidence interval
| Commodity and Type of Employer | Surface Number | Surface Rate | Surface Lower CI | Surface Upper CI |
|---|---|---|---|---|
| Coal Operator | 670 | 1.4 | 1.3 | 1.5 |
| Metal Operator | 439 | 1.6 | 1.4 | 1.7 |
| Nonmetal Operator | 264 | 1.7 | 1.5 | 2.0 |
| Stone Operator | 1,130 | 2.2 | 2.1 | 2.3 |
| Sand & Gravel Operator | 412 | 1.8 | 1.6 | 2.0 |
| Operator Total | 2,915 | 1.8 | 1.7 | 1.8 |
| Coal Contractor | 240 | 1.2 | 1.0 | 1.3 |
| Noncoal Contractor | 225 | 0.8 | 0.7 | 0.9 |
| Contractor Total | 465 | 1.0 | 0.9 | 1.1 |
| TOTAL | 3,380 | 1.6 | 1.5 | 1.6 |
See Also
- Coal Operator Mining Facts - 2005
- Data & Statistics
- Metal Operator Mining Facts - 2002
- Metal Operator Mining Facts - 2004
- Metal Operator Mining Facts - 2005
- Mining Fact Sheets
- Noncoal Contractor Mining Facts - 2003
- Nonmetal Operator Mining Facts - 2002
- Nonmetal Operator Mining Facts - 2008
- Sand and Gravel Operator Mining Facts - 2006
- Statistical Methodology
- Stone Operator Mining Facts - 2003
- Stone Operator Mining Facts - 2005
- Page last reviewed: 11/16/2016
- Page last updated: 5/10/2017
- Content source: National Institute for Occupational Safety and Health, Mining Program


 ShareCompartir
