PRODUCTIVE AGING AND WORK

Data & Statistics
What do the data show about older workers in the U.S. Workforce?
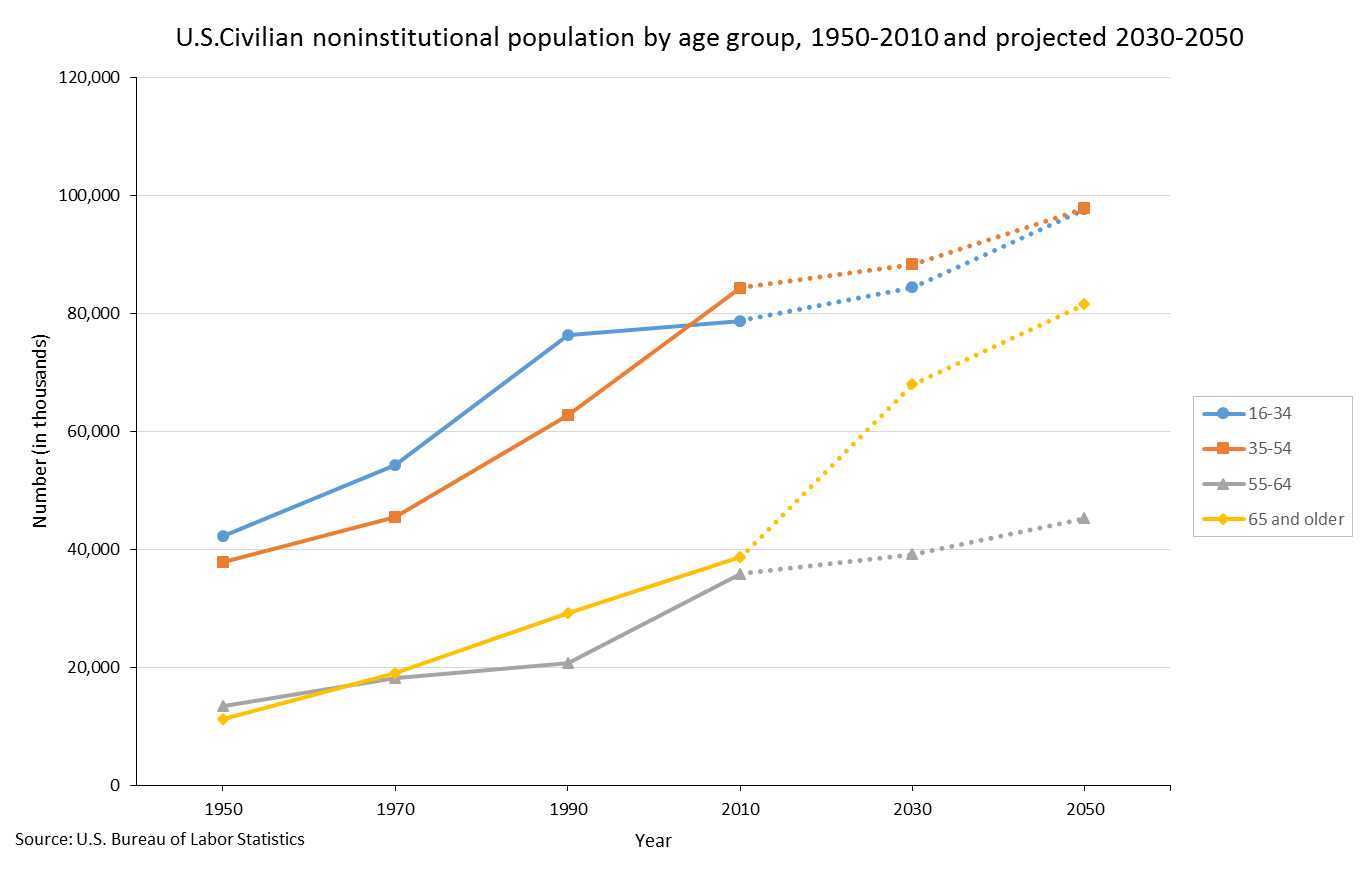
The number of older individuals in the U.S. noninstitutionalized population has grown in the last five decades and is projected to continue to grow.
Population aging is one of the driving factors of the aging of the U.S. workforce.
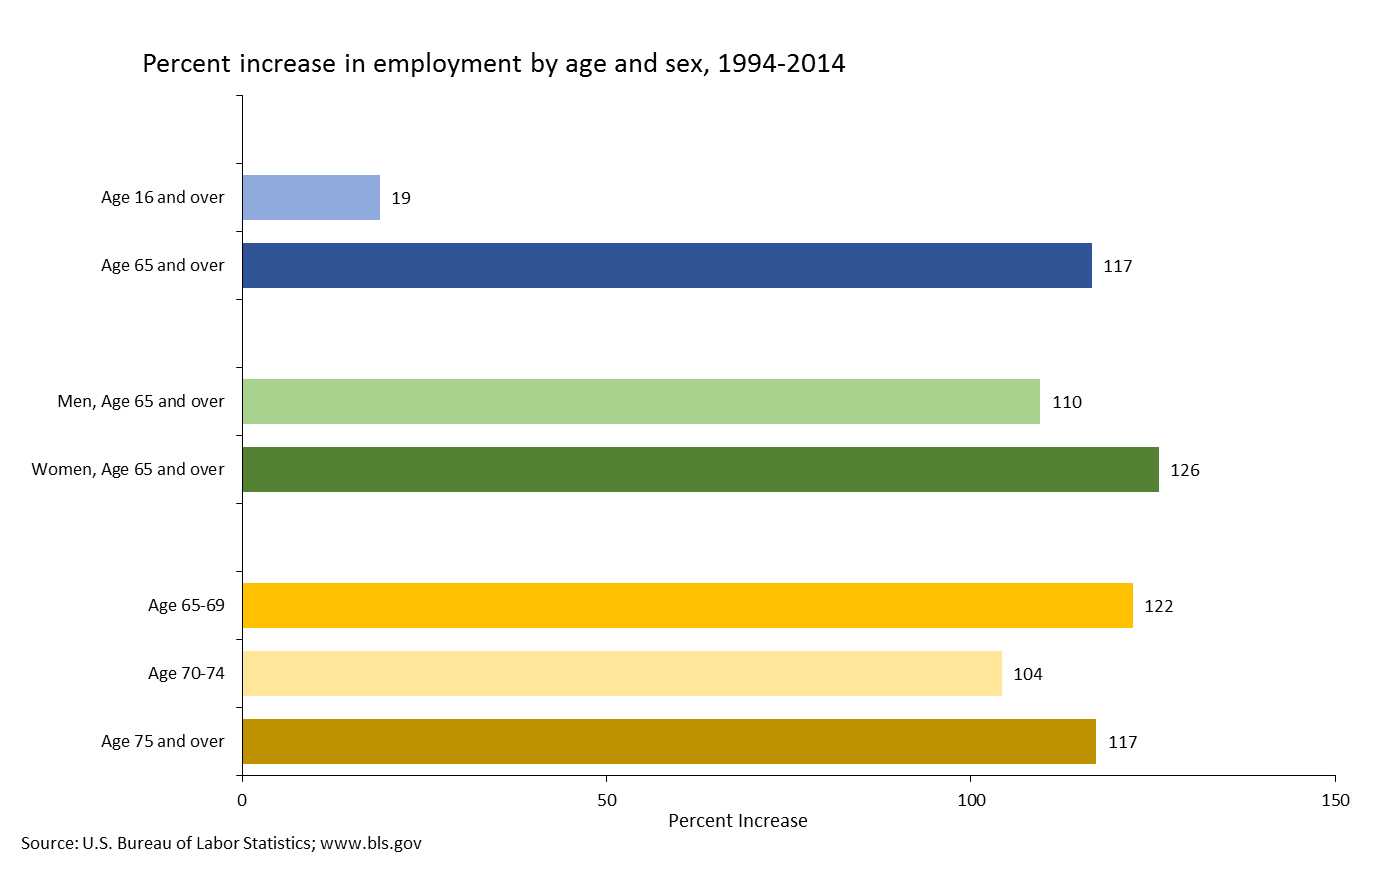
The percentage of older workers employed has grown.
According to the Bureau of Labor Statistics, employment of workers aged 65 or older has grown by 117% in a span of 20 years, while employment of individuals 75 years or older has likewise increased by 117%.
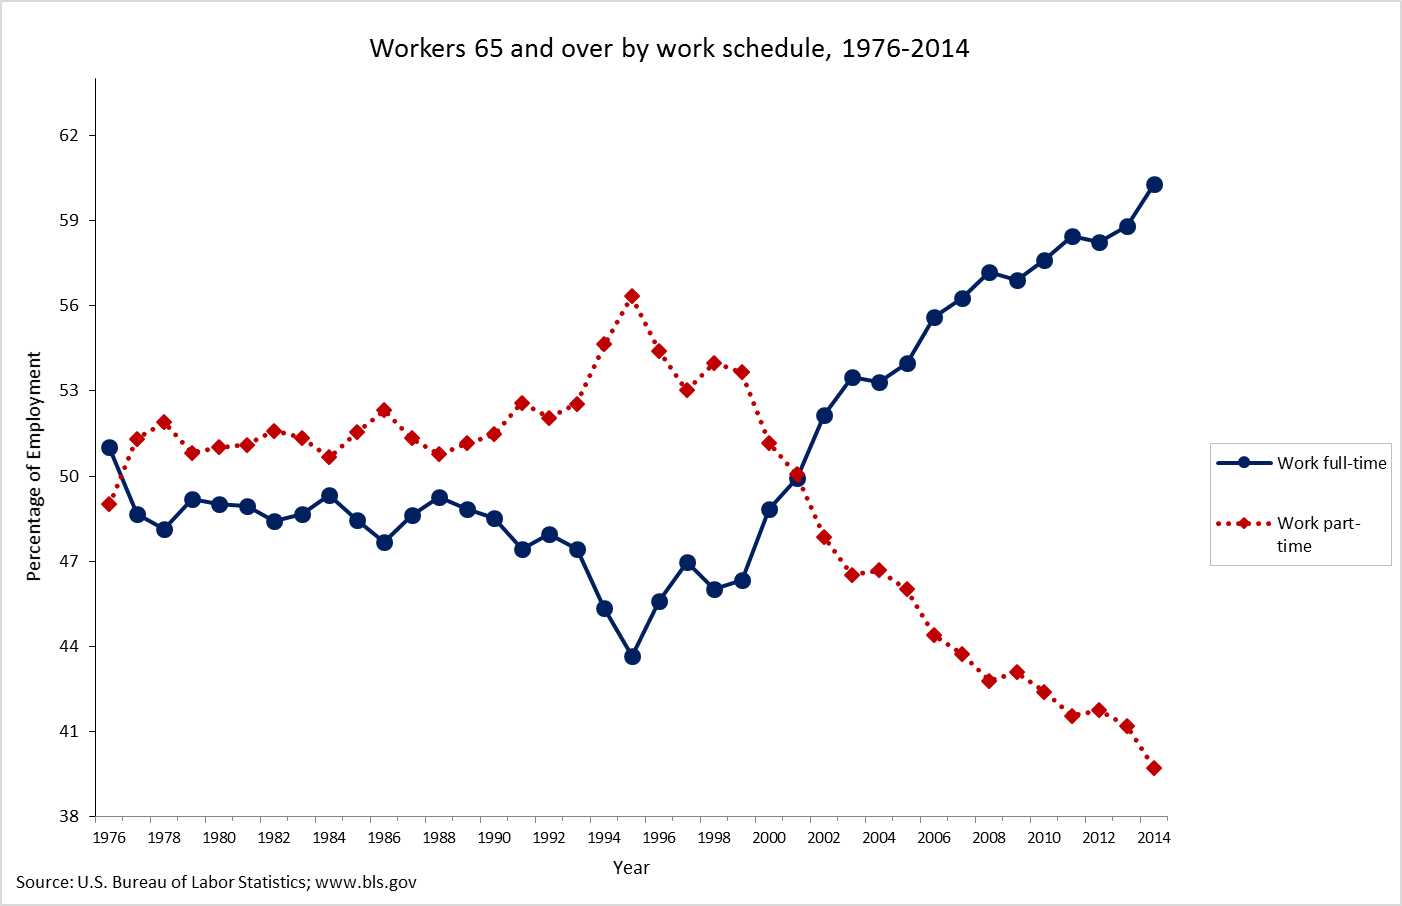
The percentage of older workers employed in full-time work has grown.
This influx of workers aged 65 or older accompanies a shift in the type of work schedule most commonly used. Particularly in the past 15 years, there has been a consistent increase in the percentage of older workers employed in full time, rather than part-time jobs.
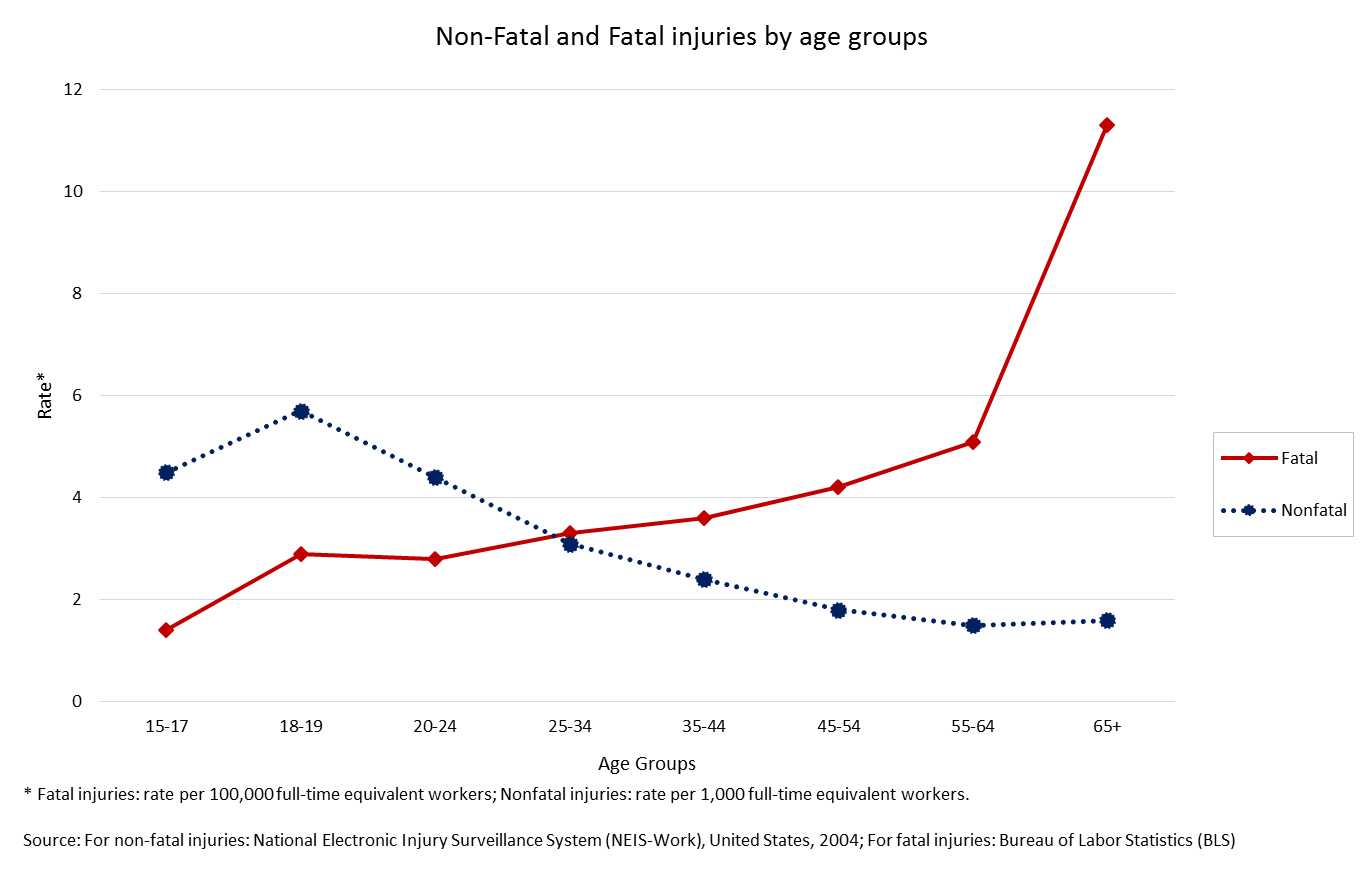
Frequency of occupational injuries among older workers decreases, but Injuries are more likely to be serious.
Frequency of occupational injuries overall decreases with advancing age; however, those injuries that do occur are more likely to be fatal for those who are older, and the frequency jumps most dramatically around age 60. The following graph shows the rates of non-fatal injuries and fatal injuries in 2004 and 2005, respectively, by age group.
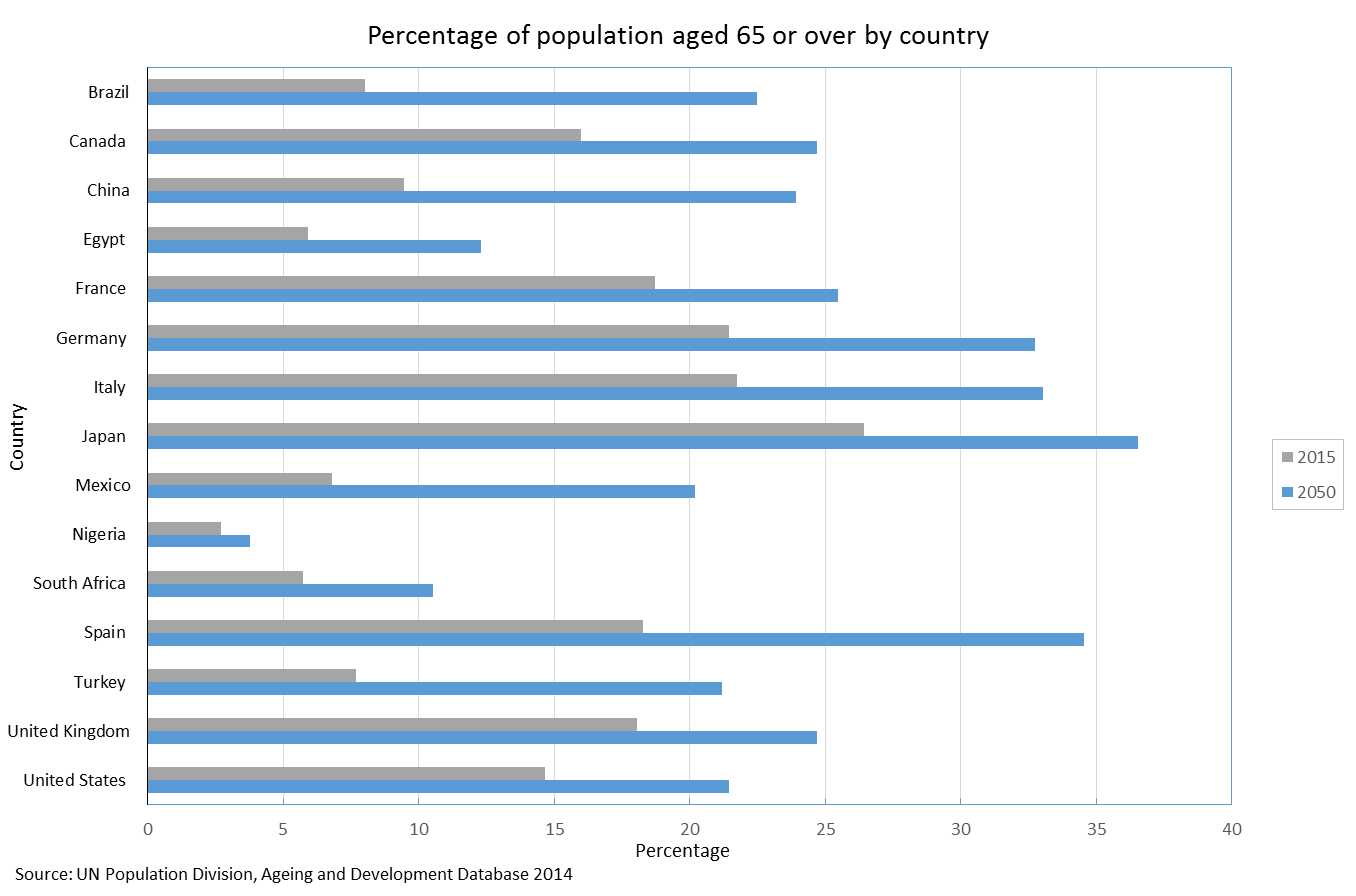
How does the aging of the U.S. population compare to other countries?
Demographic aging resulting in the increase of older populations can be observed in all regions of the world at varying degrees and stages.
 What does the future of older workers in the U.S. workforce look like?
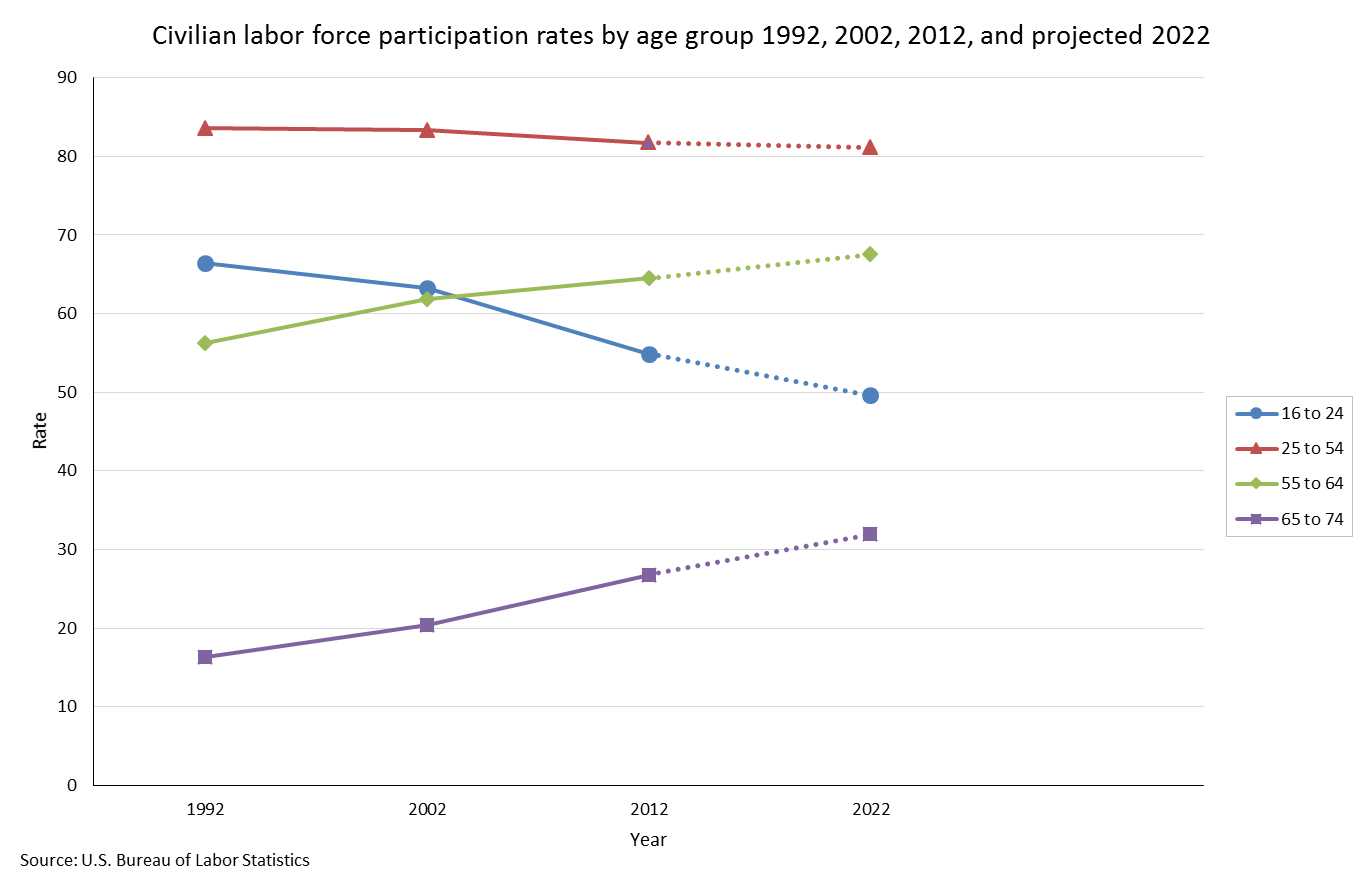
The percentage of older workers employed or seeking employment is projected to grow.
The participation rates of older workers are projected to increase, but remain significantly lower than those of the prime age group. The following graph shows civilian labor force participation rates by age group for 1992, 2002, 2012. Also displayed are projected participation rates for 2022.
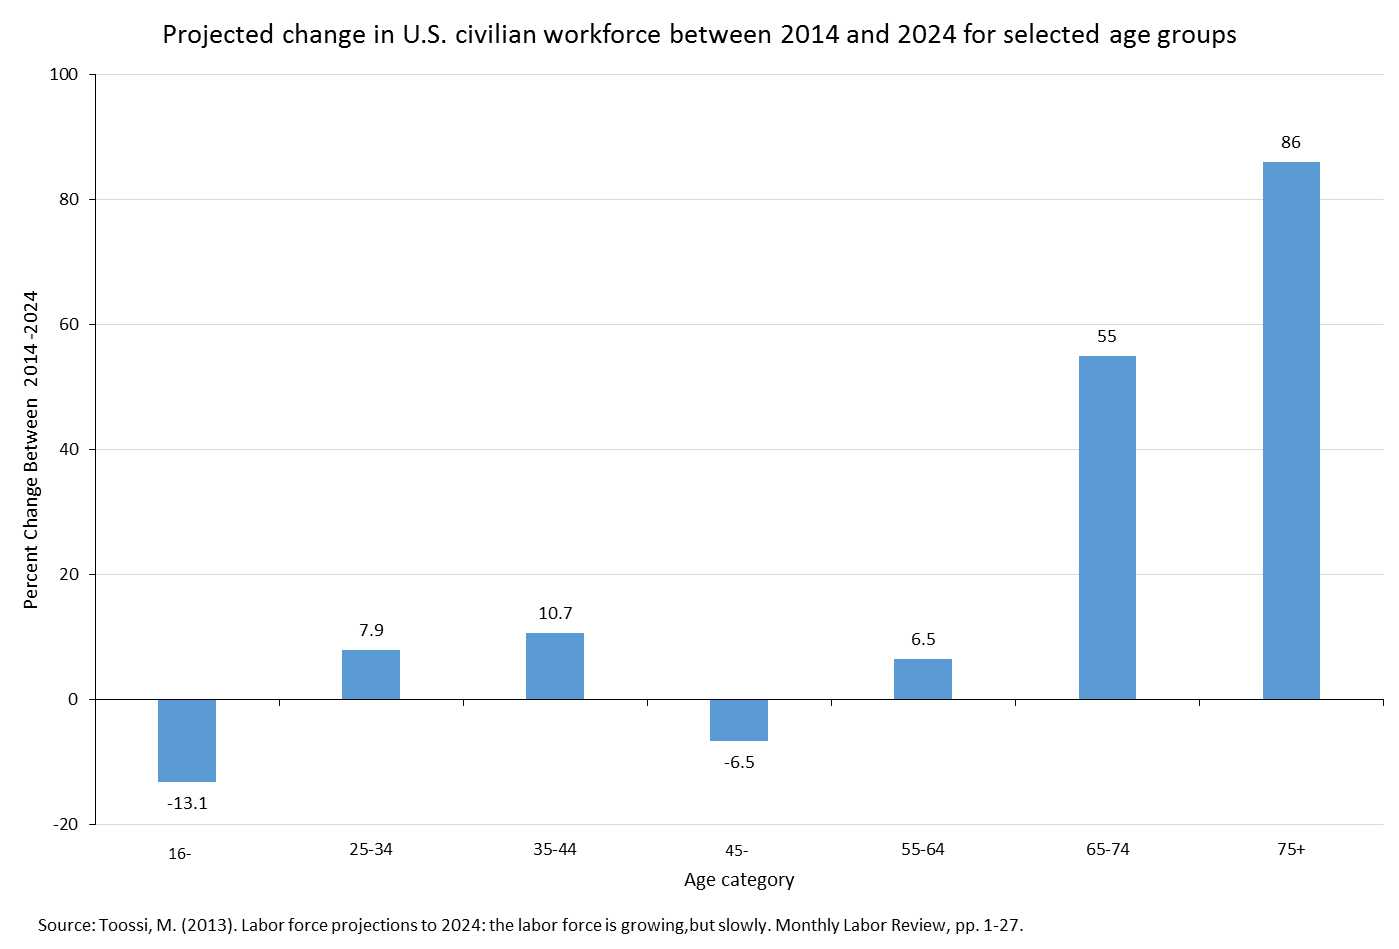
As a group, older workers are projected to show a greater percent change in employment over other age groups.
The following graph shows the projected change in the U.S. civilian workforce between 2014 and 2024 for selected age groups.
- Page last reviewed: September 11, 2015
- Page last updated: June 28, 2016
- Content source:
- National Institute for Occupational Safety and Health Education and Information Division


 ShareCompartir
