


YOUNG WORKER SAFETY AND HEALTH
 ShareCompartir
Charts on Young Worker Employment, Injuries and Illnesses
Selected Charts on Young Worker Employment, Injuries and Illnesses
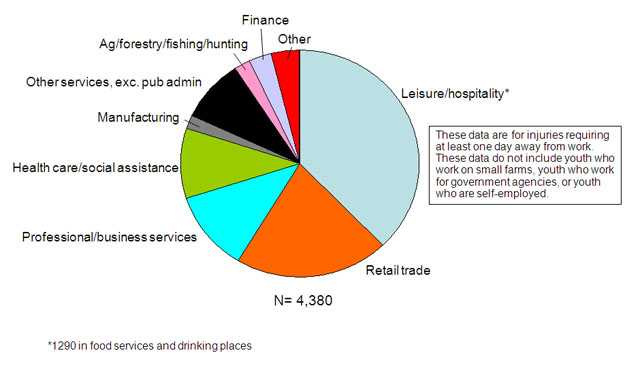
Distribution of Youth (18 Years) Work-related Injuries and Illnesses Involving Days Away from Work Reported by Private Sector Employers by Industry Sector, United States, 2009
The pie chart shows employer-reported work-related injuries and illnesses among youth that required at least a day away from work by industry sector in 2009. The industry sector with the largest numbers of injured youth was the leisure and hospitality sector, accounting for 38% of reported injuries and illnesses among youth, with most of the injuries and illnesses in food services and drinking places. The retail trade sector had the second highest frequency with 21% of reported injuries and illnesses among youth. (Source: Bureau of Labor Statistics’ (BLS) Survey of Occupational Injuries and Illnesses. The survey excludes farms with fewer than 11 employees, the self-employed, private household workers, and federal employees. Data from state and local government employees are included in the survey, but not reported above. Data were provided by James Rice of BLS.)
Download data in Excel format Download image file in PDF format
- Page last reviewed: April 11, 2017
- Page last updated: May 25, 2011
- Content source:
- National Institute for Occupational Safety and Health Division of Safety Research