

|

|

Volume
2:
No. 1, January 2005
SPECIAL TOPICS IN PUBLIC HEALTH
Childhood Obesity — What We Can Learn
From Existing Data on
Societal Trends, Part 1
Roland Sturm, PhD
Suggested citation for this article: Sturm R. Childhood obesity — what we can
learn from existing data on societal trends, part 1. Prev Chronic
Dis [serial online] 2005 Jan [date cited]. Available from: URL:
http://www.cdc.gov/pcd/issues/2005/
jan/04_0038.htm.
PEER REVIEWED
Part 1 of 2
Abstract
The number of overweight and obese youth has increased in recent decades,
and numerous theories on causes have been proposed. Yet almost no data are
available to assess how the lives of children have changed during the “obesity
epidemic.” What are children and adolescents now doing with their time that
they did not do before? Are they participating less in sports? Watching more
television? Doing more homework? Without tracking these broader societal
changes, it is difficult to identify the most (and least) promising areas for
interventions. This two-part report compiles trend data for several areas.
Part 1 discusses trends in time use, homework, and media use; part 2 discusses
trends in transportation, physical education, and diet.
The main findings of this article are the following: One, the free time of
children has substantially declined because of increased time away from home,
primarily in school, day care, and after-school programs. Two, participation
in organized activities (including sports) has also increased. Three,
unstructured playtime has decreased to make room for organized activities.
Four, time spent in some sedentary activities like watching television,
participating in conversations, or taking part in other passive leisure
activities also
declined just when obesity became a major concern. Five, increases in homework
have not caused decreases in free time, contradicting a common belief in
education circles.
Back to top
Introduction
The number of overweight and obese youth has been increasing dramatically
in recent decades, and there is no sign that this trend is ending (1).
Prevention may be one of the hallmarks of pediatric practice, but office-based
counseling offers limited leverage to counter broader changes that affect the
daily lives of children. Even though prevention and treatment in clinical
settings have been the focus for interventions in the past, researchers now
agree that trends in overweight arise from changes in social and environmental
factors that need to be understood and modified for effective prevention
(2,3). Many factors have been suggested as causes of the “obesity epidemic”
among children — reduced physical education at school, increased homework
loads, campus vending machines, television, larger portion sizes, fast-food
restaurants, video games, and countless others. Yet virtually no data track
how the lives of children have changed during the obesity epidemic; in fact,
except for the National Health and Nutrition Examination Survey (NHANES), no
reliable data exist to track weight increase among children (1).
This two-part report reviews data sources available for time trends,
summarizes trend data that have been published (typically outside the health
literature), and provides several new calculations. Finding comparable data
across several years is difficult; finding such data across several decades is
even more difficult. With purely cross-sectional data, we can only compare
instantaneous snapshots against an ideal world, but what we really want to
know is: What has changed since the time when childhood obesity was not a major
public health problem? What are children and adolescents now doing with their
time that they did not do before? How are they less physically active? Are
they participating less in sports? Without tracking these broader societal
changes, we will not easily identify the most promising areas for
intervention.
When considering an array of information, it is often useful to start
with a systematic review of the primary research literature. Systematic
reviews are most useful when multiple studies pose similar research questions.
Guidelines on clinical practice are often based on systematic reviews because
many studies have identical research questions. An
Institute of Medicine committee focused on preventing childhood obesity has
taken the systematic review approach (4) and found more than 40,000 citations
after searching the topics of
obesity, overweight, body weight, dietary patterns, and physical activity.
Unfortunately, this approach has not been very successful in identifying
information about societal trends. Much of the primary research on societal
trends does not focus on health, weight, or physical activity and contains no related key words in the abstracts. A
seminal paper on changes in children’s time use, for example, contains none of
the words or word fragments “obesity,” “overweight,” “body weight,” “diet,” or
“physical activity” anywhere in the text (5).
The approach taken here is, therefore, more eclectic by necessity. The
research literature on childhood obesity has several themes, including
transportation, media use, physical education, school hours, and diet. For
this report, all data sets on children at the Inter-university Consortium for
Political and Social Research — an organization of member institutions that
archives social science data — were scanned for articles providing time-series
data. Most sources were found, however, by the less systematic approach of
identifying the main data sets and surveys used in the fields mentioned above
and then determining whether those data could provide information on secular
trends.
Analysis of time-use data is a first step toward understanding how economic
incentives have altered behavior patterns that lead to weight gain. Indeed,
time-use data for adults are so important in tracking societal trends that in
2003 the
Bureau of Labor Statistics and the Census Bureau started to collect
time-use data. Ideally, we would like to translate time use into energy
expenditure and examine how this relationship contributes to weight gain, but
the data are not detailed enough for this task. The next section of this study
discusses existing time-use data.
When we try to understand the economic and technological forces behind
changes in time use, few technological innovations have been more important in
the lives of children and adolescents than the emergence and evolution of new
communication technologies. Technologies like cable television, videos,
computer games, and the World Wide Web have altered how children obtain
information and entertainment, but how do they affect children’s physical activity
patterns or use of time? A later section of this article
(Media) discusses available data, but unfortunately we can only calculate
trend data for television watching. Only a single cross-sectional national
survey (for 1999) provides a full assessment of all media use.
In education circles, the hypothesis that homework, or, more generally, the
academic excellence movement, plays an important role in weight gain (and/or
declining physical fitness) among children appears to be widely accepted, even
outside the United States. In surveys conducted by the Chinese University of Hong
Kong, the National University of Malaysia, Thailand’s Mahidol University, and
the Philippine Food and Nutrition Research Centre, by far the most common
reason students gave for not participating more in physical activity was
homework, cited 1.5 times more often than the runner-up,
heat/weather (6). The final section of this article reviews data sources to
investigate the hypothesis that an increase in homework has contributed to weight gain and/or
lack of physical activity.
The second part of this report in Volume 2, Issue 2 of Preventing
Chronic Disease will look at data for three other areas: transportation,
physical education, and diet.
Back to top
Time Use
We first review existing data on how American children spend their time.
There are several ways of assessing time use, but numerous methodological
studies show that the best way to collect large-scale time-use data is to use
time-diary data, where individuals describe what they have done during the
past day (7). Relatively comparable time-use data for adults have been
collected approximately every decade since the 1960s, enabling researchers to
paint a broad picture of how adult lives and physical activity have changed in
the past 40 years (8,9).
Time-use data for children are sparse, but researchers from the University of
Michigan fielded two surveys in 1981 and 1997 (5,10). Data presented in this
article are based on calculations made from data provided in detailed tables
published in 2001 (5).
Both University of Michigan surveys used 24-hour time diaries with similar
methodology. The 1981 data are based on time diaries of 222 children aged two
to 12 years. Each child provided data for one school day and one nonschool
day. The data are nationally representative (weighted for sampling probability
and post-stratification factor) and have been used in a variety of other
reports, primarily in education. The 1997 survey was an addition to the Panel
Study of Income Dynamics, a representative sample of U.S. men, women,
children, and their families. The study consisted of interviews of 2380
households containing 3563 youth and had a response rate of 88%.
Post-stratification weights based on the 1997 Current Population Survey are
used to make the data nationally representative, and sampling weights adjust
for survey design. Subsetting to children aged three to 12 years with complete
data resulted in 2119 observations.
Free/discretionary time has declined
The free time of children as a proportion of the total weekly time of 168
hours declined by approximately 12% from 1981 to 1997, if time spent eating,
sleeping, in personal care (e.g., preparing to go places, packing, getting
dressed), in school, and in child care is subtracted from the total. The
decline in free time — between seven and eight hours per week, depending on
how we treat study time or household work — is largely due to increased time
spent in school and child care and to a lesser extent to increased
personal-care time. Figure 1 shows that this decline occurred across all age
groups; data are significant at P < .01.
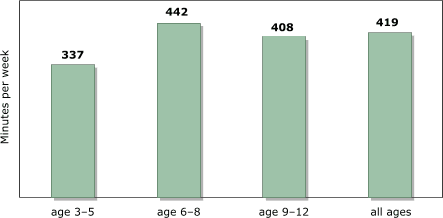
Figure 1.
Decline in discretionary time (in minutes per week) between 1981 and 1997
among U.S. children aged three to 12 years. Calculations based on data from Hofferth and Sandberg (5).
(A text description of this chart is also
available.)
Time spent in school increased about two hours per week, or 25 minutes per
school day, from 24 hours and 45 minutes to 26 hours and 48 minutes in an
average week. Day-care time increased from about 14 minutes
to almost three hours per week because both a larger share of children used
day care and children in day care spent more time in it. In Figure 2, we add
other academic activities that time-use researchers often consider
discretionary but that have similar purposes (and physical activity levels):
primarily reading and studying at home. Personal-care time also increased over
the same period, from more than six hours per week to eight hours per week.
Time-use researchers have hypothesized that as children spend more time away
from home, they need more time to get ready to do so (5). Smaller changes occurred in time spent eating, which decreased, and
sleeping/napping, which increased by the same amount (not shown). The decline
in eating time parallels a decline in the frequency with which families sit
down together to share a family meal (11). More important changes occurred in
the composition of children’s free time. While time spent in some categories
decreased by more than the average 12%, time spent in other categories
increased. Time spent viewing television as a primary activity declined by the
greatest percentage — by 23%, or about four hours per week (Figure 2, P
< .001). This decline did not take place because of a decrease in the
proportion who watched television (because almost all children watched
television during both 1981 and 1997); instead, the decline took place because
of a reduction of television time among watchers.
Several other sedentary activities declined significantly and
proportionately more than discretionary time overall: church attendance,
youth-group participation, passive leisure, and other household conversations.
In Figure 2, this group of activities represents the second largest group of
declines. But two sedentary activities at home, reading and studying (grouped
with school/day care in Figure 2), also increased.
Time spent in hobbies, organized sports, and arts activities increased,
reflecting an overall trend toward structured activities and a decline in
unstructured activities. Figure 2 groups only the more active categories
together (sports/outdoors), and they show a substantial increase. Sports
increased significantly for children younger than nine years; other categories did not change significantly. Hobbies/arts, which
include dance and music lessons (not shown here), are more active than
watching television or other passive leisure and are perhaps more comparable
to playtime.
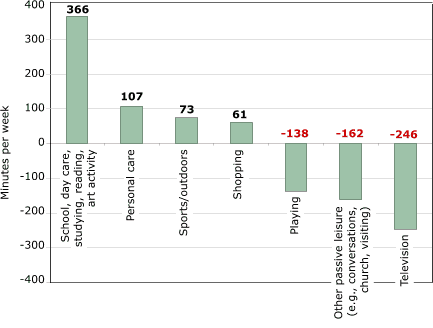
Figure 2.
Changes in time (in minutes per week) spent on activities between 1981 to
1997 by U.S. children aged three to 12
years. Calculations based on data from Hofferth and Sandberg
(5).
(A text description of this chart is also
available.)
Hofferth and Sandberg analyzed the role of shifting demographics and
maternal employment and found that few of the changes in time use could be
linked to either factor (5). While some time use differed according to
maternal education, family size, and family composition in 1981, different
socioeconomic groups tended to become more similar rather than more different
in time use.
Thus, the increase in time spent in school (which includes after-school care)
reflects changing social preferences for greater use of schools and school
activities.
Age differences
Some notable differences in time use across different age groups suggest
different levers for interventions by age group. For children aged three to
five years (Figure 3) and children aged six to eight (Figure 4), the largest
decline in time use is in playtime; for children aged nine to 12 years, the
largest decline is in television watching (Figure 5). While playtime declined
overall, it actually increased among children aged nine to 12. This increase
may reflect more video- and computer-game use among this age group. The
largest decline for children aged nine to 12 was in television watching, but
household conversations and other passive leisure also declined more in this
group than in other age groups. However, these declines may be countered by
increases in sedentary playtime; time spent in this category grew by 1.5 hours per week in this age group (Figure
5). The declines and increases may represent trade-offs between different
forms of media use, but time diaries do not reveal this level of detail.
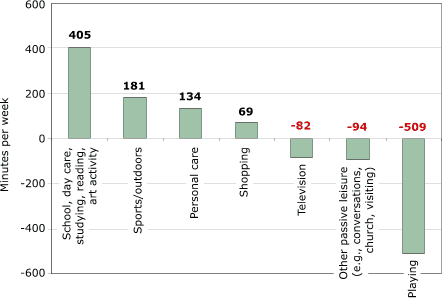
Figure 3.
Changes in time (in minutes per week) spent on activities between 1981 and 1997 by
U.S. children aged three to
five years. Calculations based on data from Hofferth and
Sandberg (5).
(A text description of this chart is also
available.)
While the dominant change is in the increase of time spent in school or day
care away from home, time spent studying at home increased significantly among
children aged six to eight, and time spent reading increased significantly
among children aged three to five. The
proportion of children aged three to five who spent time reading or being read
to doubled between 1981 and 1997. Increased reading among this age group
probably reflects increasing parental concern about preparing children for
school. Increased enrollment in day-care centers and preschools may also be
associated with children reading at early ages. We will examine homework loads
more closely in a later section to investigate claims in the popular press and
the education field that the homework burden has increased by so much that it
now constitutes an enormous time burden on students and families, preventing
them from engaging in other activities. The time-use data from the Michigan
group is often used as a key piece in this argument, so it is worth keeping
the magnitudes in mind: 76 minutes of the 485 additional minutes per week
spent in school or other learning activities among children aged six to eight
(Figure 4) were designated toward homework. Among children aged nine to 12,
however, the increase in homework was not statistically significant, and the
point estimate was an increase of 19 minutes for studying at home out of the
369 additional minutes per week in learning activities (Figure 5).
Figure 4 shows that sports/outdoor time did not increase significantly
among children aged six to eight, representing a different pattern than other
age groups. The major reason for the significant increase among children aged
three to five was the increased proportion engaging in sports, which almost
doubled over the period.
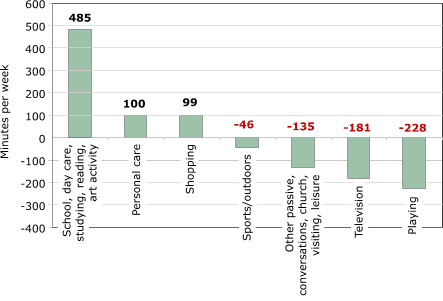
Figure 4.
Changes in time (in minutes per week) spent between 1981 and 1997 on activities by
U.S. children aged six to
eight years. Calculations based on data from Hofferth and
Sandberg (5).
(A text description of this chart is also
available.)
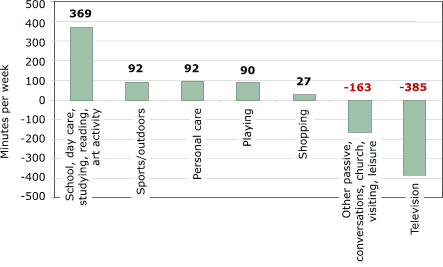
Figure 5.
Changes in time (in minutes per week) spent between 1981 to 1997 on activities by
U.S. children aged nine to 12
years. Calculations based on data from Hofferth and
Sandberg (5).
(A text description of this chart is also
available.)
In summary, the largest change in children’s time use in the past two
decades was a decline in discretionary/free time, paralleled by an increase in
school or day care and personal care. Particularly noteworthy are significant
declines in many categories of passive leisure (television, conversations,
other passive leisure) and increases (statistically insignificant) in
sports/outdoor time. Increases in sports participation were largest among
children of non-working mothers; thus, these increases did not result from
increases in maternal employment (5,10). Children with less time to play
mostly reflect decreased time spent at home. Children may be playing in their
preschool programs, and they may have some free time at school, so the level
of aggregation presented here provides only a partial picture of children’s
time and activity levels. Sports/outdoor time outside school is increasing,
mainly among preschool children, but the increase in sports is significant for
both the three-to-five and nine-to-12 age groups. Given the large increase in
time children spend in school or day care, it is also important that children
have enough physical activity in those settings. Moreover, the amount of time
children participate in more physically challenging activities in school or
day-care settings should have increased over time, corresponding to the total
increase that children are now away from home. To what extent this has
or has not occurred requires different data.
Back to top
Media
The first complete national data on media use among American youth were
collected in 1999 by the Kaiser Family Foundation project, Kids & Media @ The New
Millennium (12). Other surveys have examined children’s use of selected media
(most commonly television watching), but no data allow us to track media use
comprehensively over time.
Despite interest in new media (e.g., computers, video games), television
remains by far the dominant medium (Table). The impact of computers and video
games on sedentary behavior is probably not very large, especially when
compared with television, as they together comprise only about 10% of the
average daily media budget of children aged two to 18. There are, however,
large differences by age and sex. Children younger than eight years spent a
negligible amount of time on video games or computers in 1998, but boys aged
eight to 13 averaged 47 minutes per day playing video games (13). On the other
hand, children aged eight to 12 also experienced the largest decline
(approximately 50 minutes per day) in television watching between 1981 and
1997.
No comparable surveys track the latest changes for all children, although
it is likely that computer use has increased since the Kaiser Family
Foundation survey. Video gaming may or may not have peaked already by 1999. A
new survey fielded in 2003 for children younger than seven years found that
one in five children aged four to six plays computer games in a typical day
(14). A new trend certainly is that some computers and video games target
preschoolers.
Television has been around for a much longer time and because of its
continuing dominance, it has received more attention. Television may
contribute directly to obesity by reducing energy expenditure through
displacing physical activity or indirectly by increasing dietary intake —
through snacking during viewing or changing eating patterns caused by food
advertising. Numerous cross-sectional studies found significant positive
associations between television viewing and youth obesity; prospective studies
include some null findings, but a randomized trial confirmed that a reduction
in television watching can reduce weight gain (15-17).
Assessing time trends, even for television, is difficult because small
differences in methods across different surveys create methods effects that
far exceed real underlying changes. Nevertheless, we can compile some
consistent time trends. The time-diary data suggest that children under 12 are
now watching less television than they did in the past, a decline of about
23%, or about six hours per week between 1981 and 1997 (Figure 2). The Monitoring the Future survey confirms that this trend also holds for
adolescents (Figure 6): there has been a substantial decline in heavy television watching
and an increase in the proportion of adolescents watching one hour or less
daily (18). Monitoring the Future is a large and nationally representative study;
the documented decline is therefore very likely to represent a true effect.
There are no conclusive data on whether the large decline in television
viewing is more than offset or only partially offset by new-media use (e.g.,
video games, computer).
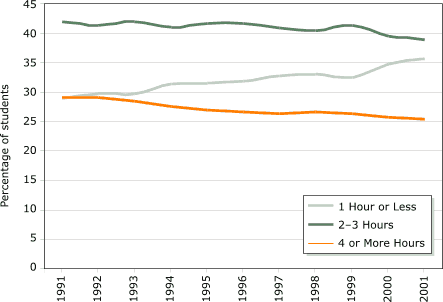
Figure 6.
Percentage of teenagers who spend one hour or less, two to three hours, or
four hours or more watching television on average weekday, 1991–2001. Analysis
based on annual data from Monitoring the Future (18).
Reprinted with permission from Child Trends. (A text description of this chart is also
available.)
Back to top
Studying at Home
Many news reports and academic and popular books claim that homework
overburdens children and limits learning with lack of physical activity and
weight gain as major secondary consequences (19). Although most of the
evidence for this idea is anecdotal, we noted above that time spent on home
study by children aged six to eight did increase between 1981 and 1997. This
fact has been cited in a number of news reports and in the book The End of Homework, which is subtitled, How Homework Disrupts
Families, Overburdens Children, and Limits Learning (19).
Gill and Schlossman used several national surveys to provide a 50-year
perspective on time spent on homework; a summary of their main findings
follows (20).
The most systematic evidence on homework time at multiple grade levels
across the country is found in answers to background questions asked of
students taking the National Assessment of Educational Progress (NAEP). The
data are nationally representative and based on large samples. Most variables
show little change. Variables that do change, however, tend to show increases
in the 1970s and early 1980s and declines in the 1990s (20). Figure 7 shows the
trends: increases in the early 1980s were followed by a decline in the 1990s,
resulting in figures for 1999 that are similar to those for 1980. Overall,
increased time spent studying at home does not appear to be related to the obesity
epidemic among youth.
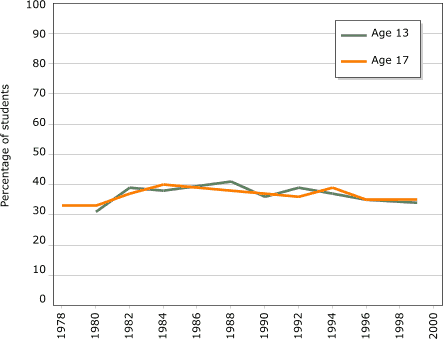
Figure 7.
Proportion of U.S. students doing one hour or more of homework. Data available for every other year starting 1978–1996
(except 1986), plus 1999; data not available for children aged 13 in
1978. Data from Gill and Schlossman (20). Copyright 2003 by the American Educational Research Association. Reprinted
with permission from publisher. (A text description of this chart is also
available.)
Homework loads for elementary-level students deserve further analysis,
however. The NAEP data collection for children aged nine (third or fourth
grade) started only in 1984. Figure 8 shows two indicators: rates of homework
assignment and the proportion of students doing more than one hour of homework
the night before the survey. Clearly, the number of students with homework
assigned the prior day has increased, consistent with an increase in average
study time, but the one-hour-or-more trend line — flat or even declining —
indicates that the daily time increase cannot have been very large. Regular
daily assignments may also distribute work more evenly throughout the week and
therefore decrease the probability of working one hour or more on any given
day.
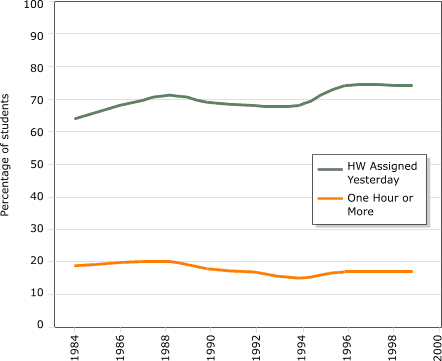
Figure 8.
Homework trends for children aged nine years. Data available every other
year 1984–1996 (except 1986), plus 1999. Data from Gill and Schlossman (20).
Copyright 2003 by the American Educational Research Association. Reprinted
with permission from publisher. (A text description of this chart is also
available.)
Combining several different data sets, we can track the proportion of high
school students doing substantial homework over the half-century from 1948
though 1999. High school students during the late 1940s and early 1950s
studied no more or less than their counterparts did in the 1970s, 1980s, and
1990s; only during the 1960s did homework time temporarily increase (20).
Back to top
Summary
In contrast to adults, who now have more free time than in the past,
children have less free time than previously because of increased time away
from home, primarily in school, day care, and after-school programs (5,8,9).
Participation in organized activities (including sports) also increased. Time
spent in many sedentary activities — television viewing, conversations, or
other passive leisure — declined just when obesity became a major concern.
Unstructured playtime also declined except for in older children, but it is not
clear whether this playtime was sedentary or active. The role of new media is
not fully clear, although it is unlikely to have played a substantial role
prior to 1999, except for children eight to 12 who spent a significant amount
of time playing video games (considered unstructured playtime in the time-use
data). But this age group also watched much less television at the turn of the
century than in the 1980s.
Increased homework burdens and time studying at home have not caused a
decrease in free time, contradicting a common belief in education circles. The
great majority of American children at all grade levels now spend less than
one hour studying on a typical day — an amount that has not changed
substantially for at least 20 years. Compared to the large changes in other
uses of time, it appears unlikely that changes in homework have altered the
activity levels of children.
As time in structured settings away from home increases, so does the
importance of physical activity in those settings. A substantial percentage of
youth (about one third of high school students) is insufficiently active. An
increase in structured time offers opportunities for interventions that may be
more successful at expanding the number of youth who meet minimum-guideline
criteria for strenuous physical activity than interventions targeted at
diverse and unstructured home environments. In Part 2 of this report,
we will look at trends in transportation, physical education, and diet.
Back to top
Acknowledgments
This report was prepared for the Robert Wood Johnson Foundation. Tania
Andreyeva and Hilary Rhodes provided research assistance.
Back to top Author Information
Corresponding author: Roland Sturm, PhD, RAND, 1700 Main
St, Santa Monica, CA 90401. Telephone: 310-393-0411 ext 6164. E-mail: Roland_Sturm@rand.org.
Back to top
References
- Ogden CL, Flegal KM, Carroll MD, Johnson CL.
Prevalence and trends in
overweight among US children and adolescents,1999-2000. JAMA 2002;288(14):1728-32.
- Hill JO, Peters JC.
Environmental contributions to the obesity epidemic.
Science 1998;280(5368):1371-4.
- Hill JO, Wyatt HR, Reed GW, Peters JC.
Obesity and the environment:
where do we go from here? Science 2003;299(5608):853-5.
- Institute of Medicine, Committee on Prevention of Obesity in Children
and Youth. Preventing childhood obesity:
health in the balance. Washington (DC): National Academies Press;
forthcoming 2004 Sep.
- Hofferth SL, Sandberg JF. Changes in American children's time, 1981-1997.
In: Owens T, Hofferth S, editors. Children at the millennium: where have we
come from, where are we going? Advances in life course research. New
York: Elsevier Science; 2001.
- Straits Times [Internet]. Asian kids blame homework, heat for not
exercising. Singapore: Singapore Press
Holdings; 2004 [updated 2003 Nov 5; cited 2004 Mar 12]. Available from: URL:
http://straitstimes.asia1.com.sg/health/ story/0,4395,209633,00.html*.
- Juster F, Stafford FP. Time, goods, and well-being. Ann Arbor (MI): Institute for Social Research; 1985.
- Robinson JP, Godbey GG. Time for life: the surprising ways Americans use
their time. 2nd ed. University Park (PA): Pennsylvania State
University Press; 1999.
- Sturm R. The economics of physical activity: societal trends and
rationales for intervention. Am J Prev Med 2004;27(3S):126-35.
- Hofferth SL, Sandberg JF. How American children use their time. J Marriage Fam 2001;63(3).
- Kinney DA, Dunn JS, Hofferth SL. Family strategies
for managing the time crunch. Paper presented at Conference on Work and
Family: Expanding the Horizons; 2000 Mar 3-4; San Francisco, CA.
- Kaiser Family Foundation. Kids & media @ the new millenium [Internet]. Menlo Park (CA): The Henry J. Kaiser Family Foundation; 2003
[updated 2003 Dec 10; cited 1999 Nov 15]. Available from: URL:
http://www.kff.org/entmedia/1535-index.cfm*.
- Kaiser Family Foundation. Key facts: children and videogames [Internet]. Menlo Park (CA): The Henry J. Kaiser Family Foundation; 2003 [updated 2004 March 23; cited 2002 Oct 24]. Available
from: URL:
http://www.kff.org/entmedia/3271-index.cfm*.
- Kaiser Family Foundation. Zero to six: electronic media in
the lives of infants, toddlers and preschoolers
[Internet]. Menlo Park (CA): The Henry J. Kaiser Family Foundation; 2003
[updated 2004 March 23; cited 2003 Oct 28]. Available from: URL: http://www.kff.org/entmedia/3378.cfm*.
- Robinson TN.
Does television cause childhood obesity? JAMA
1998;279(12):959-60.
- Robinson TN.
Reducing children's television viewing to prevent obesity:
a randomized controlled trial. JAMA 1999;282(16):1561-7.
- Robinson TN.
Television viewing and childhood obesity. Pediatr Clin
North Am 2001;48(4):1017-25.
- Child Trends Data Bank. Monitoring the Future [Internet]. Washington
(DC): Child Trends. Available from: URL: http://www.childtrendsdatabank.org/ indicators/55WatchingTV.cfm*.
- Kravolec E, Buell J. The end of homework: how homework disrupts
families, overburdens children, and limits learning. Boston: Beacon Press;
2000.
- Gill BP, Schlossman SL. A nation at rest: the American way of homework.
Educational Evaluation and Policy Analysis 2003;25(3):319-37.
Back to top |
|
