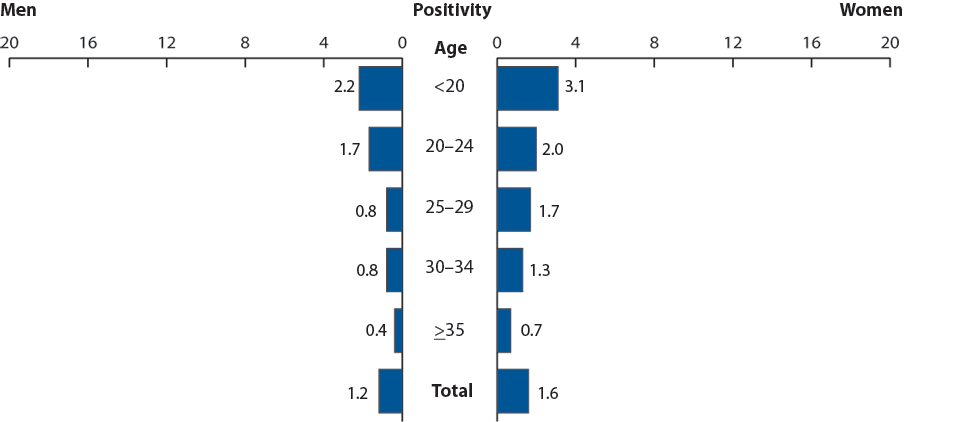
Figure DD. Gonorrhea—Positivity by Age Group and Sex, Adult Corrections Facilities, 2009
This web page is archived for historical purposes and is no longer being updated. Newer data is available on the STD Data and Statistics page.

NOTE: Positivity percentage is presented from facilities reporting more than 100 test results.
- Page last reviewed: November 22, 2010 (archived document)
- Content source:


 ShareCompartir