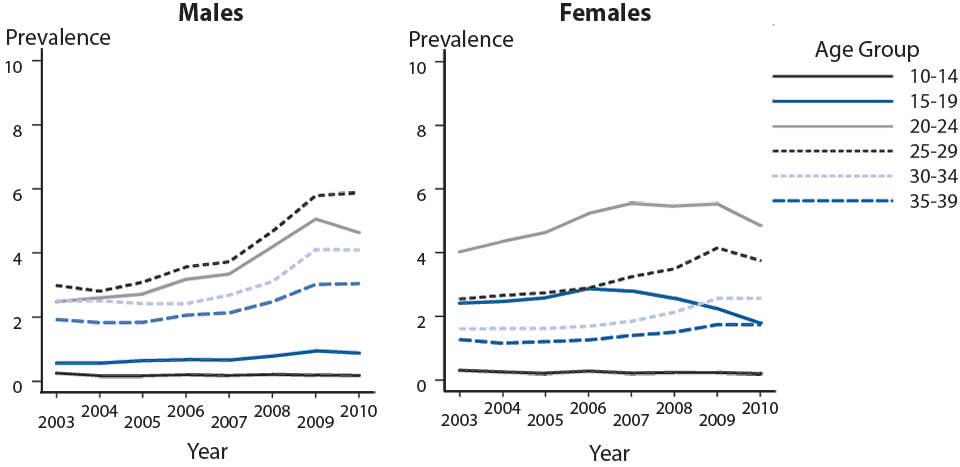
Figure 50. Genital Warts — Prevalence per 1000 Person-Years Among Participants in Private Health Plans Aged 10–39 Years by Sex, Age Group, and Year, 2003–2010
This web page is archived for historical purposes and is no longer being updated. Newer data is available on the

SOURCE: Flagg EW, Schwartz R, Weinstock H. Prevalence of anogenital warts among participants in private health plans in the United States, 2003–2010: potential impact of human papillomavirus vaccination. Am J Public Health. 2013;103(8):1428–35.
- Page last reviewed: December 16, 2014 (archived document)
- Content source:


 ShareCompartir