The State of STDs - Infographic
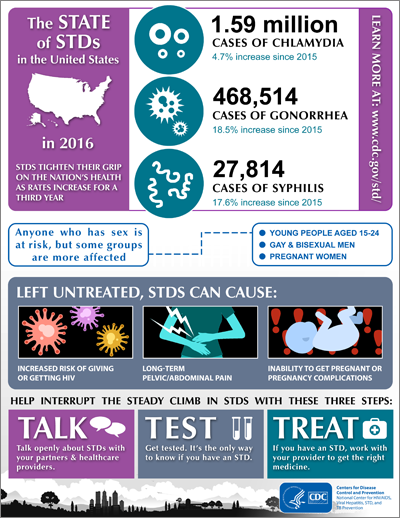
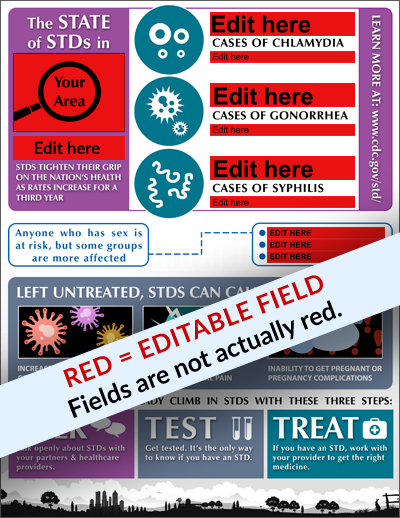
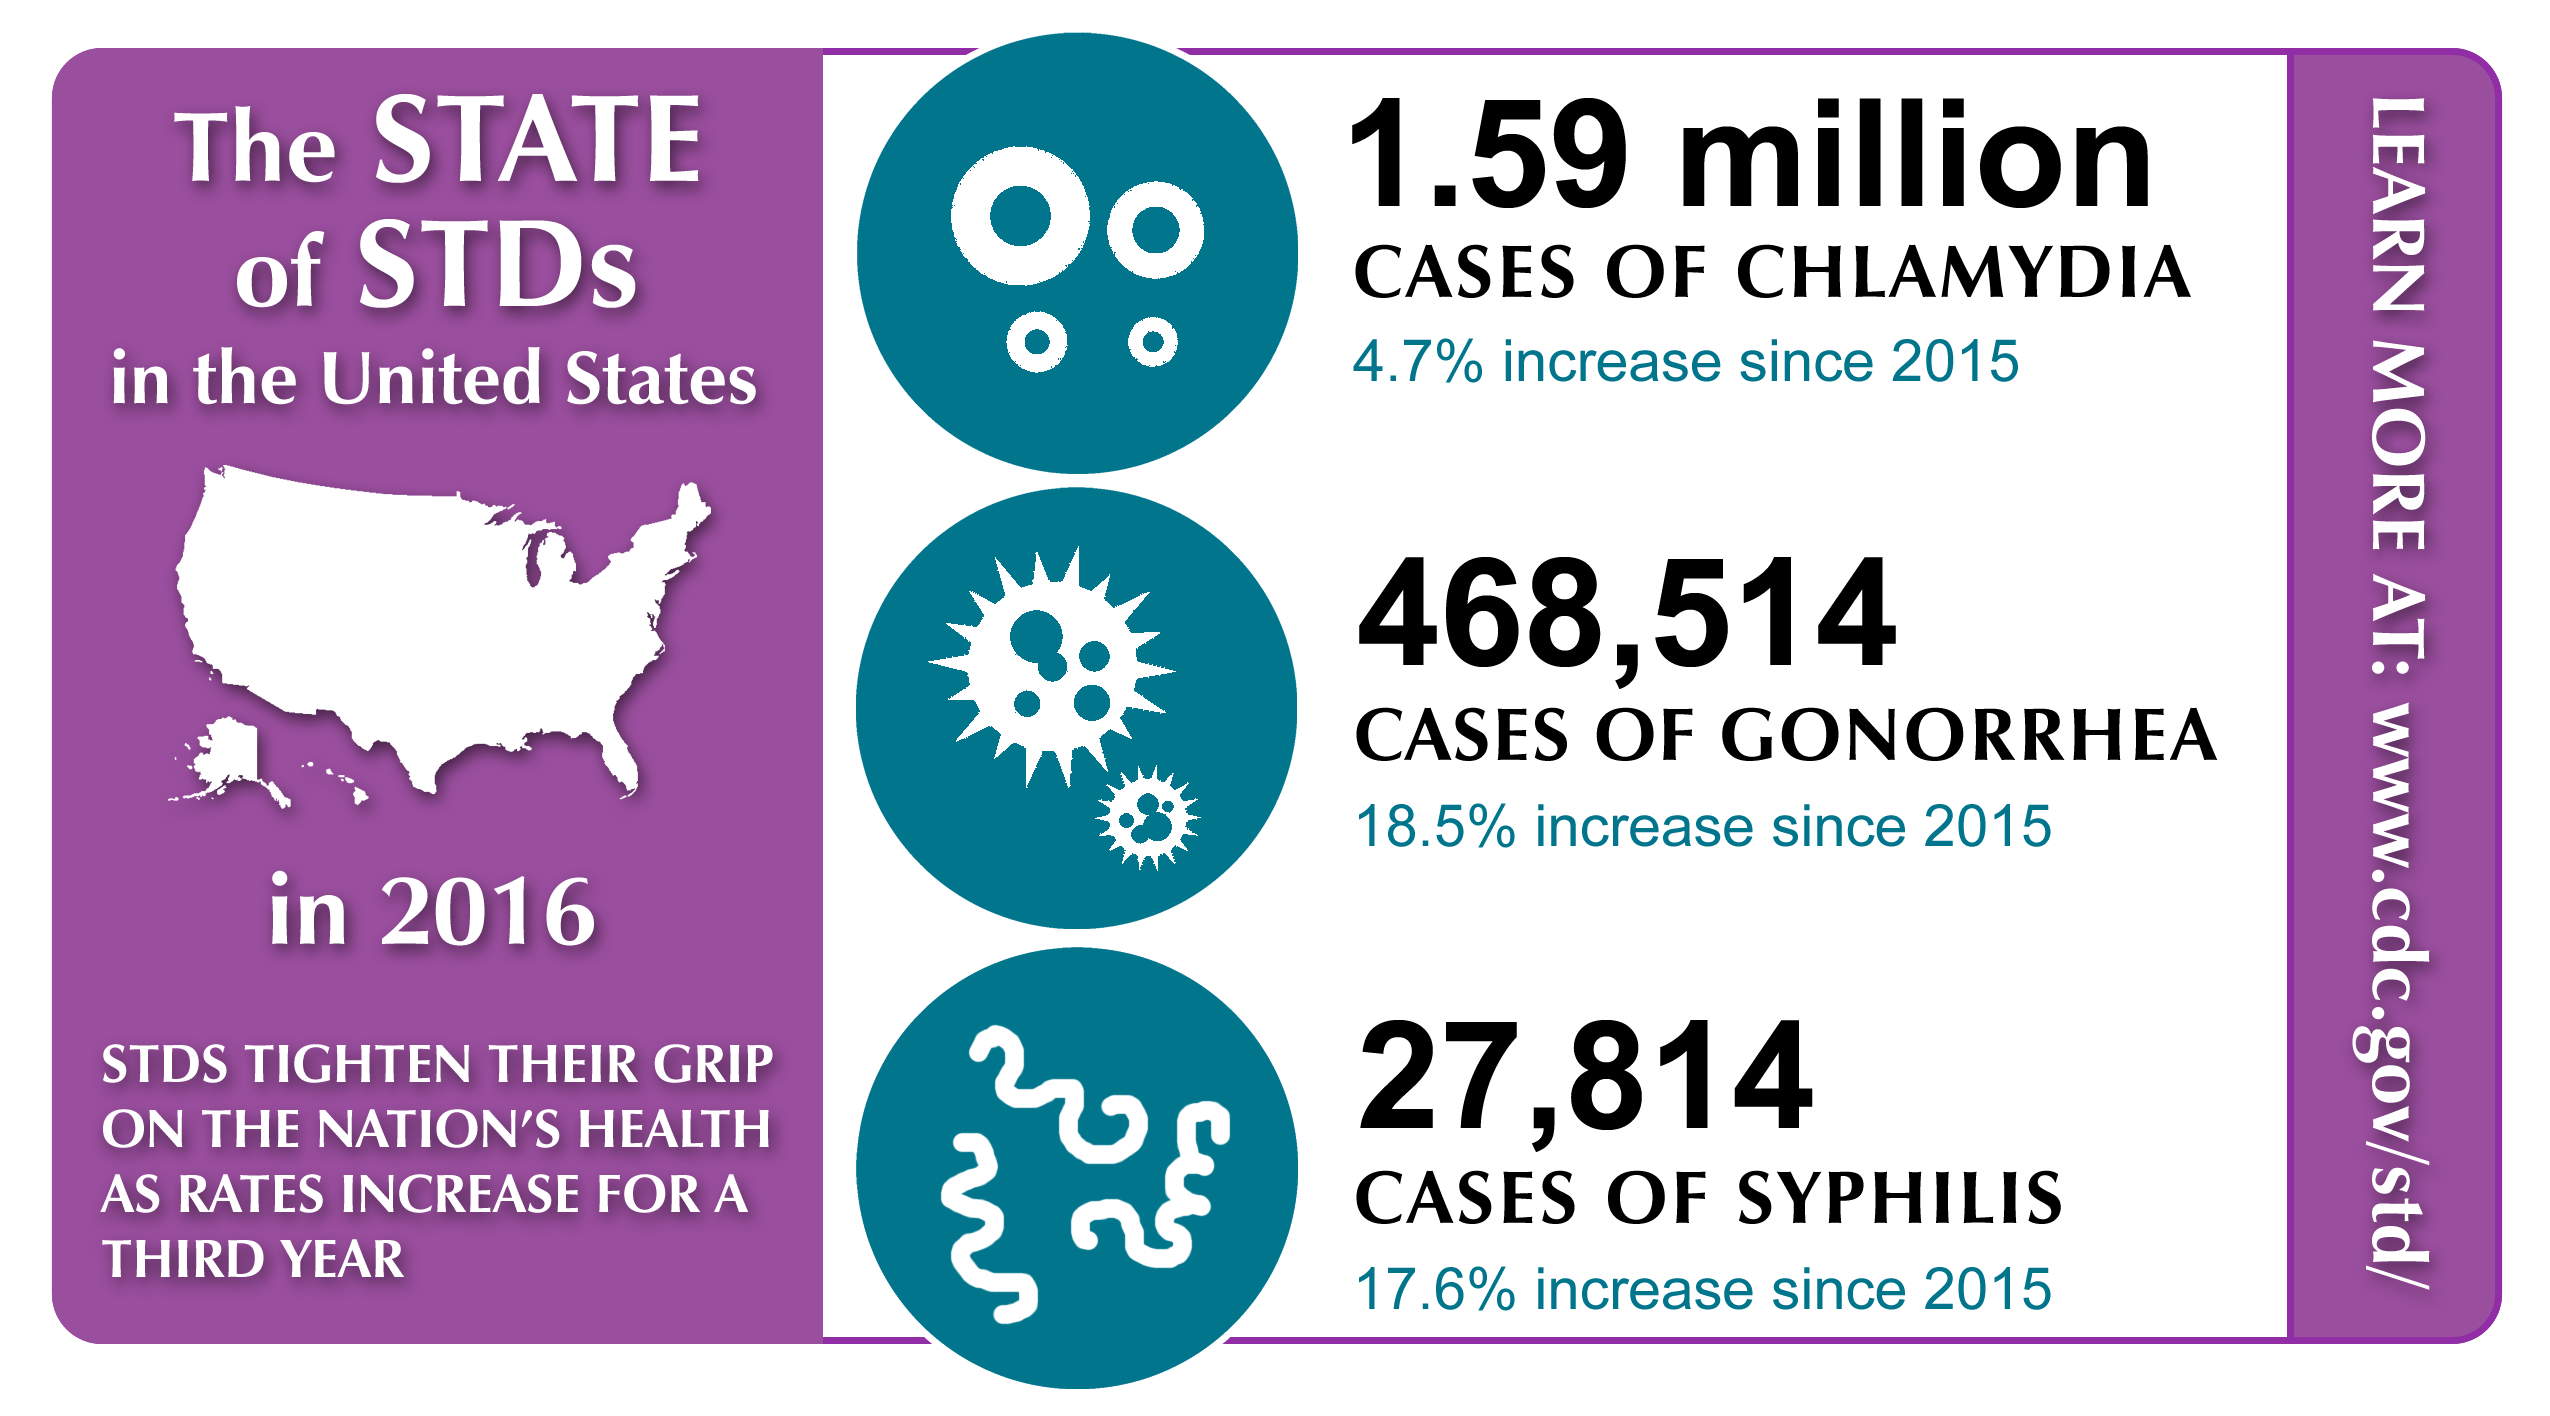
This infographic highlights statistics for the three reportable STDs, as well as the populations most affected by these diseases, consequences of untreated STDs, and ways to prevent them. We have developed two PDFs to share this information: the National infographic and the Customizable infographic. The National infographic provides national-level 2016 STD Data. The Customizable infographic allows you to add state or local-level STD data to post on your website and share in your community. Portions of the infographic are also available to share over social media.
National Version

If you only need national data and do not wish to edit the infographic, just download the document [PDF – 251kb]. It is US letter-sized.
Customizable Version

The customizable version has 10 fields you can modify to reflect local data. Instructions and download link can be found here.
- Page last reviewed: September 26, 2017
- Page last updated: September 26, 2017
- Content source:


 ShareCompartir


