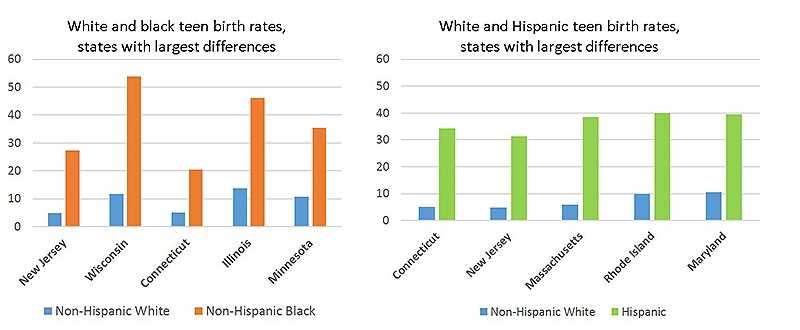
Series of two bar charts showing that in some states, black and Hispanic teen birth rates are more than three times higher than white rates.

Series of two bar charts showing that in some states, black and Hispanic teen birth rates are more than three times higher than white rates. The first chart compares white and black teen birth rates across 5 states with the largest differences, and the second compares white and Hispanic teen birth rates across states with the largest differences.
Chart 1:
White teen birth rates (births per 1,000 females ages 15-19)
New Jersey, 4.8
Wisconsin, 11.8
Connecticut, 5.1
Illinois, 13.7
Minnesota, 10.8
Black teen birth rates (births per 1,000 females ages 15-19)
New Jersey, 27.4
Wisconsin, 53.8
Connecticut, 20.4
Illinois, 46.1
Minnesota, 35.5
Chart 2:
White teen birth rates (births per 1,000 females ages 15-19)
Connecticut, 5.1
New Jersey, 4.8
Massachusetts, 6
Rhode Island, 10
Maryland, 10.5
Hispanic teen birth rates (births per 1,000 females ages 15-19)
Connecticut, 34.3
New Jersey, 31.3
Massachusetts, 38.4
Rhode Island, 40
Maryland, 39.6
- Page last reviewed: April 5, 2016
- Page last updated: April 5, 2016
- Content source:


 ShareCompartir