Child Injury infographic

Global graphic:
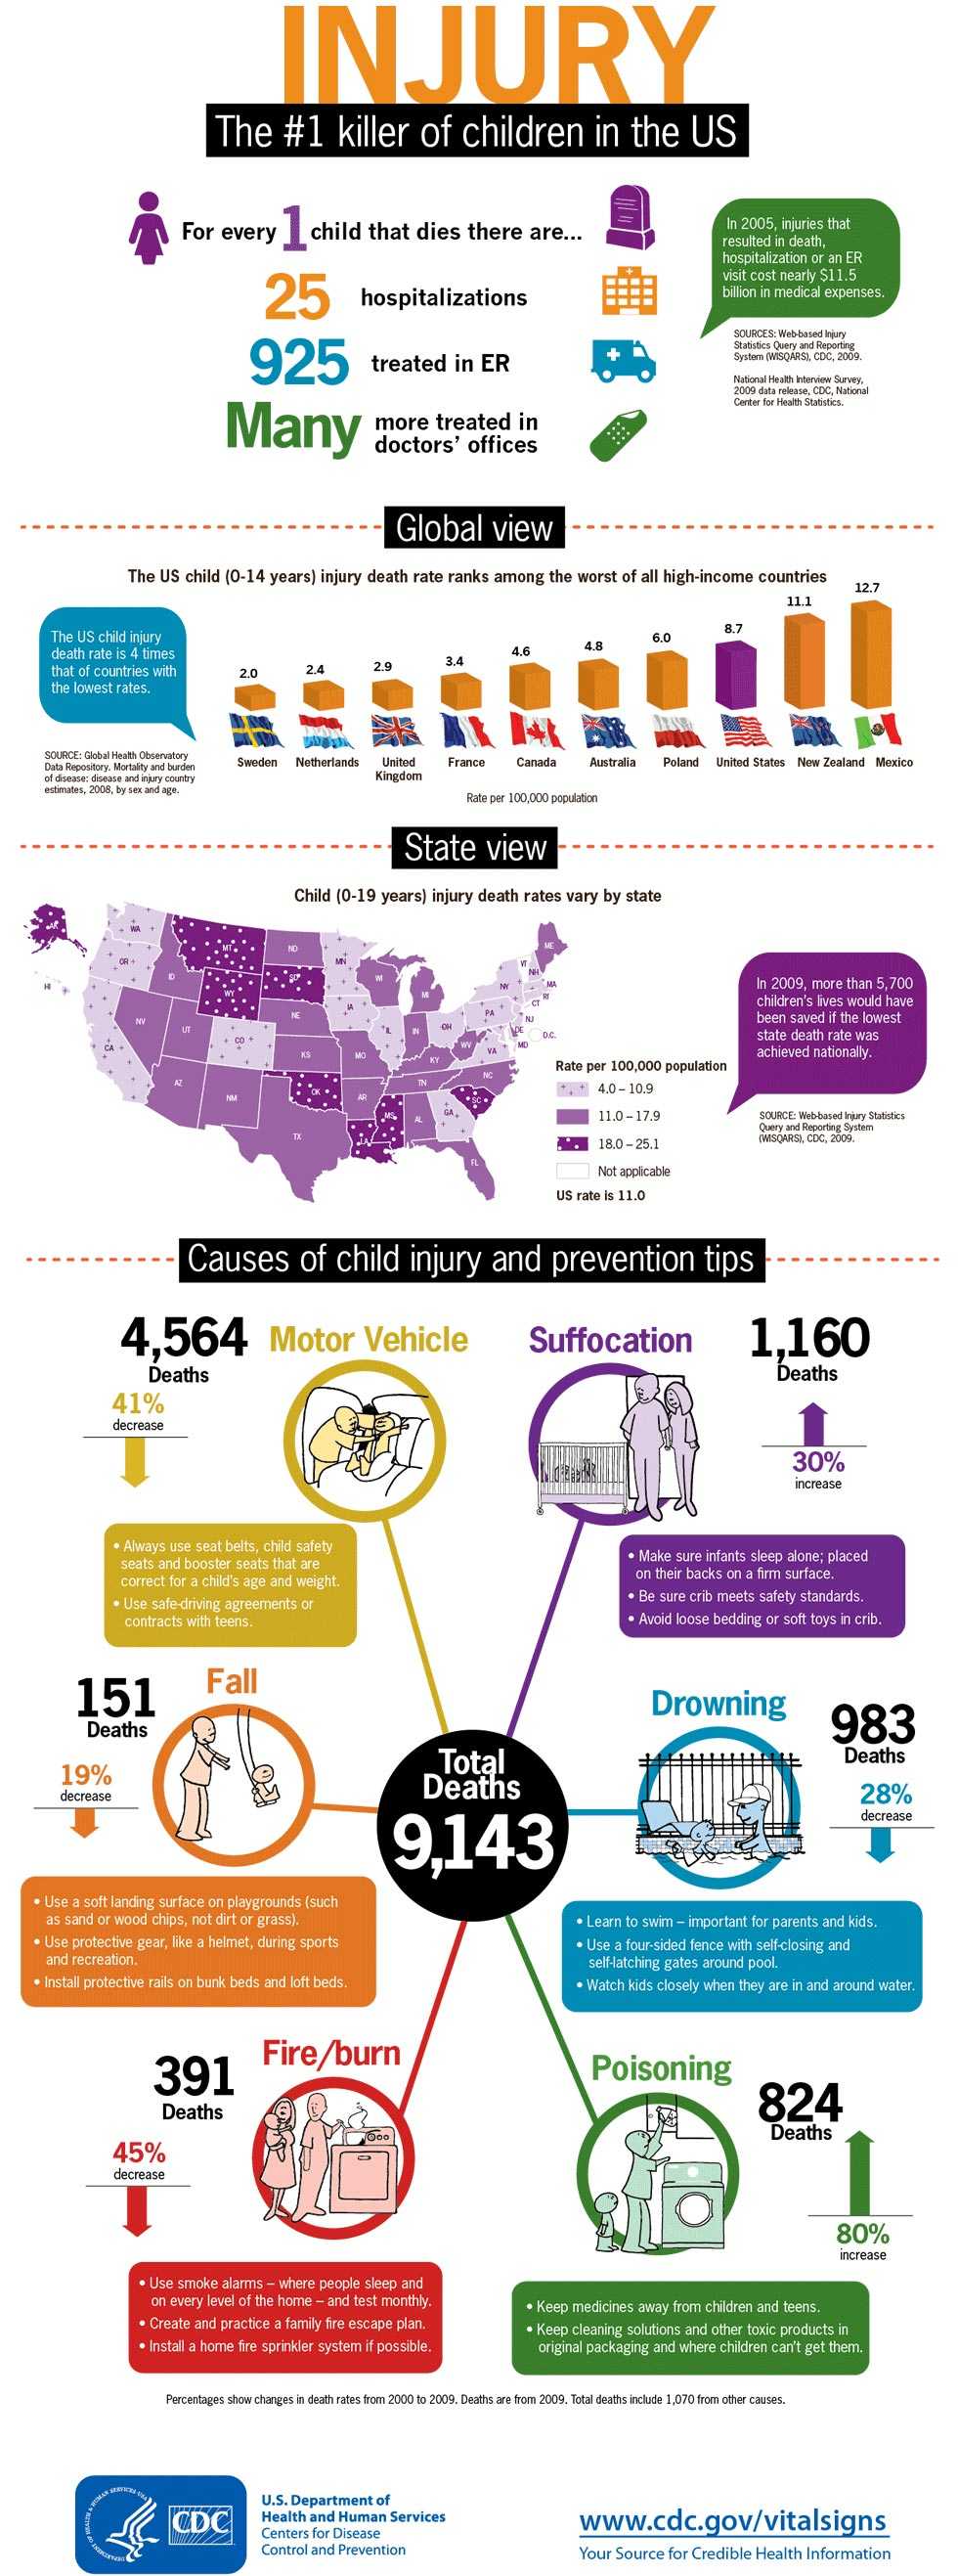
This figure shows the child injury death rate among children 0-14 years of high-income countries old per 100,000 people, in 2008. The country with the lowest child injury death rate is Sweden with a rate of 1.96, followed by the Netherlands (2.38), United Kingdom (2.85), France (3.39), Canada (4.64), Australia (4.84), and Poland (5.97). The US ranks among the worst with a rate of 8.65, 4 times greater than the country with the lowest rate (Sweden, 1.96). The United States is followed by New Zealand with a rate of 11.08 and Mexico at 12.72.
State Map:
Map of the United States showing the child injury death rates for each state per 100,000 children 0-19, in 2009. States with the highest rates of child injury, 18.0 to 25.9 per 100,000 children 0-19, include: South Carolina, Alaska, Oklahoma, Louisiana, Wyoming, Montana, South Dakota, and Mississippi.
States with child injury death rates from 11.0 to 17.9 per 100,000 children 0-19 include: Utah, Arizona, Maine, Wisconsin, Nebraska, Delaware, Michigan, West Virginia, Texas, Indiana, North Carolina, Tennessee, Florida, Idaho, Nevada, Kansas, Missouri, Kentucky, North Dakota, Alabama, Arkansas, and New Mexico.
States with the lowest rates of child injury death, 4.0 to 10.9 per 100,000 children 0-19 include: Massachusetts, New Jersey, Connecticut, New York, California, Rhode Island, Maryland, Illinois, Virginia, Oregon, Minnesota, New Hampshire, Ohio, Colorado, Washington, Pennsylvania, Iowa, Georgia, and Hawaii.
Vermont and Washington, DC do not have enough child injury deaths to report and are suppressed on the map
Causes of child injury and preventative tips
There are many causes of child injury. In 2009, 9,143 children died from injuries. This graphic includes information on the number of deaths in 2009, the rate change in deaths between 2000 and 2009, and injury prevention tips for each of the most common causes of injury including motor vehicle, suffocation, drowning, poisoning, fires/burns, and falls.
[Picture of: adult buckling a child in a car seat] In 2009, 4,564 children died from motor vehicle related injuries. Between 2000 and 2009 there was a 41% increase in the motor vehicle related injury death rates. To prevent motor vehicle related deaths: always use seat belts, child safety seats, and booster seats that are correct for a child's age and weight; and use safe-driving agreements or contracts with teens.
[Picture of: adults checking on baby on its back on a firm surface in an empty crib] In 2009, 1,160 children died from suffocations. Between 2000 and 2009, there was a 30% increase in the suffocation death rate. To prevent suffocations: make sure infants sleep alone, placed on their backs, on a firm surface; be sure cribs meet safety standards; and avoid loose bedding or soft toys in the crib.
[Picture of: adult and child playing safely in pool together] In 2009, 983 children died due to drowning. Between 2000 and 2009, there was a 28% decrease in the drowning death rate. To further reduce the number of children dying from drowning: everyone should learn to swim; use a four-sided fence with self-closing and self-latching gates around the pool; and watch kids closely when they are in or around water.
[Picture of: adult putting a cleaning solution in its original container away in a cabinet where a child cannot reach] In 2009, 824 children died from poisonings. Between 2000 and 2009 there was an 80% increase in the poisoning death rate, largely due to prescription drug overdoses. To prevent poisonings: keep medicine away from children and teens; keep cleaning solutions and other toxic products in original packaging and where children can't get them.
[Picture of: adults cooking safely over stove] In 2009, 391 children died from fires or burns. Between 2000 and 2009, there was a 45% decrease in the fire/burn death rate. To further reduce the number of children dying from fires and burns: use smoke alarms – where people sleep and on every level of the home – and test monthly; create and practice a family fire escape plan; and install a home fire sprinkler system if possible.
[Picture of: adult pushing a child on a swing] In 2009, 151 children died from falls. Between 2000 and 2009, there was a 19% decrease in the fall death rate. To further reduce the number of children dying from falls: use a soft landing surface on playgrounds (such as sand or wood chips, not dirt or grass); use protective gear, like a helmet, during sports and recreation; and install protective rails on bunk beds and loft beds.
- Page last reviewed: April 16, 2012
- Page last updated: April 16, 2012
- Content source:
Error processing SSI file


 ShareCompartir