Key Injury and Violence Data
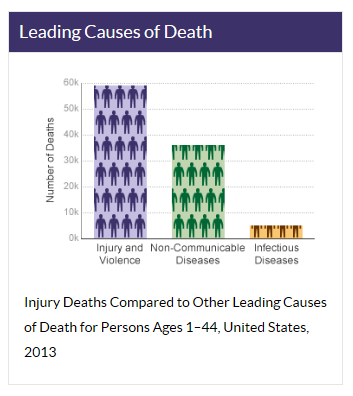
 Injuries and violence affect everyone, regardless of age, race, or economic status. In the first half of life, more Americans die from violence and injuries — such as motor vehicle crashes, falls, or homicides — than from any other cause, including cancer, HIV, or the flu. This makes injury the leading cause of death among persons 1-44.
Injury- and violence-related deaths are only part of the problem
Nearly 199,800 people die from injury each year—1 person every 3 minutes.1 But these deaths are on the tip of the iceberg. Each year, millions of people are injured and survive. They are faced with life-long mental, physical, and financial problems.
- 2.5 million people were hospitalized due to injuries in 20142
- 26.9 million people were treated in an emergency department for injuries in 20142
Injury and violence also has an alarming economic toll. The total costs of injuries and violence in the United States was $671 billion in 2013. The costs associated with fatal injuries was $214 billion while nonfatal injuries accounted for over $457 billion.3
Unintentional Injury Data
- Motor vehicle crashes are a leading cause of death in the U.S. More than 33,700 people died from motor vehicle crashes in 2014 alone.1
- Opioid overdoses have quadrupled since 1999, with more than 14,800 people dying from prescription opioid overdoses in 2014.4
- Each year, 2.7 million older people are treated in emergency departments for fall injuries.2
- In 2012, approximately 325,000 children were treated in emergency departments for sports and recreation-related injuries that included a diagnosis of concussion or traumatic brain injury.5
Violence Data
- There were 678,932 victims of child abuse and neglect reported to Child Protective Services (CPS) in 2013.6
- On average, 20 people per minute are victims of physical violence by an intimate partner in the United States. Over the course of a year, that equals more than 10 million women and men.7
- Nearly 1 in 5 women (19.3%) and 1 in 59 men (1.7%) have been raped in their lifetime.7
References
-
- Centers for Disease Control and Prevention, National Center for Injury Prevention and Control. Web-based Injury Statistics Query and Reporting System (WISQARS) Fatal Injury Data. (2016)
- Centers for Disease Control and Prevention, National Center for Injury Prevention and Control. Web-based Injury Statistics Query and Reporting System (WISQARS) Nonfatal Injury Data. (2016)
- Florence C, Simon T, Haegerich T, et al. Estimated Lifetime Medical and Work Loss Costs of Fatal Injury, United States 2013. MMWR 2015;64(38).
Florence C, Haegerich T, Simon T, et al. Estimated Lifetime Medical and Work Loss Costs of Emergency Department Treated Nonfatal Injuries, United States 2013. MMWR 2015;64(38). - Centers for Disease Control and Prevention. National Vital Statistics System mortality data. (2016)
- Coronado VG, Haileyesus T, Cheng TA, Bell JM, Haarbauer-Krupa J, Lionbarger MR, Flores-Herrera J, McGuire LC, Gilchrist J. Trends in sports- and recreation-related traumatic brain injuries treated in US emergency departments: The National Electronic Injury Surveillance System-All Injury Program (NEISS-AIP) 2001-2012. J Head Trauma Rehabil 2015; 30(3): 185–197.
- U.S. Department of Health and Human Services, Administration for Children and Families, Administration on Children, Youth and Families, Children’s Bureau (2015). Child Maltreatment 2013.
- Breiding MK, Smith SG, Basile KC, et al. Prevalence and Characteristics of Sexual Violence, Stalking, and Intimate Partner Violence Victimization—National Intimate Partner and Sexual Violence Survey, United States, 2011. MMWR 2014;63(SS08);1-18.
- Page last reviewed: September 19, 2016
- Page last updated: September 19, 2016
- Content source:
- Centers for Disease Control and Prevention, National Center for Injury Prevention and Control


 ShareCompartir
