 |
|
|
|
|
|
|
| ||||||||||
|
|
|
|
|
|
|
||||
| ||||||||||
|
|
|
|
|
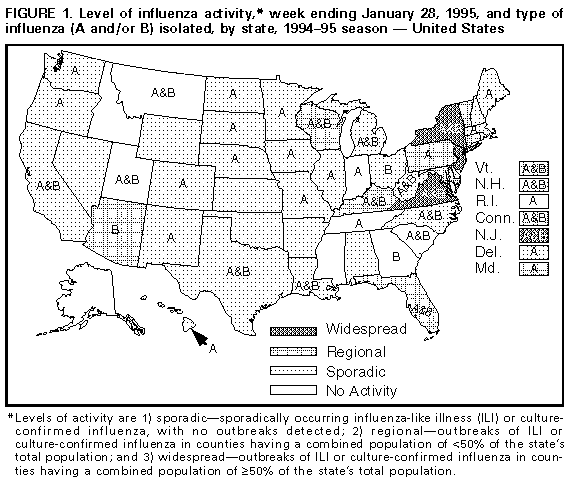
Persons using assistive technology might not be able to fully access information in this file. For assistance, please send e-mail to: mmwrq@cdc.gov. Type 508 Accommodation and the title of the report in the subject line of e-mail. Update: Influenza Activity -- United States, 1994-95 SeasonInfluenza activity has increased throughout the United States since late November 1994; however, the level of activity * has varied widely in different parts of the country. This report summarizes results of influenza surveillance in the United States from October 2, 1994, through January 28, 1995. From November 27, 1994, through January 21, 1995, most influenza activity had been reported from the Northeast Figure_1. Regional influenza activity was first reported the week ending December 3 in New York, and widespread activity was first reported the week ending January 7 in Connecticut and Virginia. Regional or widespread activity also was reported by Kentucky, Maryland, New Jersey, and Pennsylvania during the first 3 weeks of January. All other states reported either sporadic activity or no activity until the week ending January 28, when regional activity was reported for the first time in Arizona, Florida, and Wisconsin. From October 2, 1994, through January 28, 1995, a total of 686 influenza virus isolates were reported in the United States by the World Health Organization collaborating laboratories. Of these, 487 (71%) were type A, and 199 (29%) were type B. Of the 216 influenza A isolates that were subtyped, all have been type A(H3N2). Laboratory-diagnosed influenza has been reported from all regions; however, 84% of all isolates have been reported from the Mid-Atlantic and South Atlantic regions. In the Mid-Atlantic region, influenza type A accounted for 94% (259 of 276) of all isolates; in the South Atlantic region, influenza type B accounted for 59% (176 of 297) of isolates. As of January 27, influenza isolates were reported from 41 states; type A had been identified in 39 states and the District of Columbia, and influenza type B had been identified in 22 states and the District of Columbia Figure_1. During the 17 weeks from October 2, 1994, through January 28, the proportion of pneumonia and influenza deaths among total deaths reported from 121 U.S. cities slightly exceeded the epidemic threshold ** during 5 weeks but has not exceeded the threshold for any 2 consecutive weeks. Reported by: Participating state and territorial epidemiologists and state public health laboratory directors. World Health Organization collaborating laboratories. Sentinel Physicians Influenza Surveillance System of the American Academy of Family Physicians. WHO Collaborating Center for Surveillance, Epidemiology, and Control of Influenza, Div of Viral and Rickettsial Diseases, National Center for Infectious Diseases, CDC. Editorial NoteEditorial Note: The increase in influenza activity in regions of the United States during December and January suggests the potential for increased activity in other regions during this influenza season. The timing of influenza activity can vary widely from one season to another; in some previous seasons, substantial influenza activity has occurred during April and May. Influenza vaccine can be administered after influenza activity has begun in a community; however, in these circumstances, short-term antiviral prophylaxis may be indicated because antibody may not develop until up to 2 weeks after vaccination (1). Health-care providers should be informed about findings of influenza surveillance, particularly when influenza types A and B are cocirculating, because of the availability of antiviral agents to treat and prevent influenza type A (1). Reference
* Levels of activity are 1) sporadic -- sporadically occurring influenza-like illness (ILI) or culture-confirmed influenza, with no outbreaks detected; 2) regional -- outbreaks of ILI or culture-confirmed influenza in counties having a combined population of less than 50% of the state's total population; and 3) widespread -- outbreaks of ILI or culture-confirmed influenza in counties having a combined population of greater than or equal to 50% of the state's total population. ** The epidemic threshold is 1.645 standard deviations above the seasonal baseline calculated using a periodic regression model applied to observed percentages since 1983. This baseline was calculated using a robust regression procedure. Figure_1  Return to top. Disclaimer All MMWR HTML versions of articles are electronic conversions from ASCII text into HTML. This conversion may have resulted in character translation or format errors in the HTML version. Users should not rely on this HTML document, but are referred to the electronic PDF version and/or the original MMWR paper copy for the official text, figures, and tables. An original paper copy of this issue can be obtained from the Superintendent of Documents, U.S. Government Printing Office (GPO), Washington, DC 20402-9371; telephone: (202) 512-1800. Contact GPO for current prices. **Questions or messages regarding errors in formatting should be addressed to mmwrq@cdc.gov.Page converted: 09/19/98 |
|||||||||
This page last reviewed 5/2/01
|