 |
|
|
|
|
|
|
| ||||||||||
|
|
|
|
|
|
|
||||
| ||||||||||
|
|
|
|
|
Persons using assistive technology might not be able to fully access information in this file. For assistance, please send e-mail to: mmwrq@cdc.gov. Type 508 Accommodation and the title of the report in the subject line of e-mail. Engineering and Administrative Recommendations for Water Fluoridation, 1995Summary In April and September 1993, CDC convened two advisory workshops to review and revise fluoridation recommendations. Since 1979, CDC has developed guidelines and/or recommendations for managers of fluoridated public water systems. This report summarizes the results of these two workshops and consolidates and updates CDC's previous recommendations. Implementation of these recommendations should contribute to the achievement of continuous levels of optimally fluoridated drinking water for the U.S. population, minimize potential fluoride overfeeds (i.e., any fluoride level that is greater than the recommended control range of the water system), and contribute to the safe operation of all fluoridated water systems. The report delineates specific recommendations related to the engineering aspects of water fluoridation, including administration, monitoring and surveillance, technical requirements, and safety procedures. The recommendations address water fluoridation for both community public water supply systems and school public water supply systems. INTRODUCTION Water fluoridation is the deliberate addition of the natural trace element fluorine (in the ionic form as fluoride) into drinking water in accordance with scientific and dental guidelines (1-9). Fluoride is present in small yet varying amounts in almost all soil, water supplies, plants, and animals and, thus, is a normal constituent of all diets (10). In mammals, the highest concentrations are found in the bones and teeth. Since 1945, many studies have demonstrated the oral health benefits of fluorides and fluoridation. In 1945 and 1947, data from four studies (Grand Rapids, Michigan; Newburgh, New York; Brantford, Ontario CanadaĄ; and Evanston, Illinois) demonstrated the oral health benefits of fluoridated water in several communities and established water fluoridation as a practical, effective public health measure that would prevent dental caries (11-14). Data have consistently indicated that fluoridation is safe and is the most cost-effective and practical means for reducing the incidence of dental caries (tooth decay) in a community (15-28). However, additional studies have demonstrated that the oral health benefits are reduced if the optimal level of fluoride is not maintained (29-30). In the past, maintaining the optimal level without active monitoring/surveillance programs has been difficult. In the 1970s, approximately half of the systems presumed to be fluoridated were not consistently maintaining the optimal fluoride concentrations. Since the late 1970s, CDC has developed technical and administrative guidelines and/or recommendations for correcting inconsistencies in fluoridated public water supply systems (CDC, unpublished data; 31-33). In April and September of 1993, CDC convened two advisory workshops to review and revise fluoridation guidelines. Participants included 11 technical experts from state agencies and the Indian Health Service. Additional comments were obtained from state dental officials, state drinking water personnel, and others (e.g., schools of public health, dental societies, and engineers from private industry). The intent of these recommendations is to provide guidance to federal, state, and local officials involved in the engineering or administrative aspects of water fluoridation, which should help ensure that fluoridated water systems are providing optimal fluoride levels. This report provides information from earlier studies linking fluoridation with the reduction of dental caries, summarizes the conclusions of the workshops, provides recommendations for fluoridation of both community and school public water supplies, and consolidates previous recommendations. These recommendations are written with the assumption that the reader either has an engineering background or at least is familiar with basic water supply engineering principles. As an aid to readers, a glossary of technical terms is included. BACKGROUND History of Water Fluoridation The capacity of waterborne fluoride to prevent tooth decay was recognized in the early 1900s in Colorado Springs, Colorado, when a dentist noted that many of his patients' teeth exhibited tooth discoloration (i.e., "Colorado Brown Stain"). Because that condition had not been described previously in the scientific literature, he initiated research about the condition and found that Colorado Brown Stain -- now termed fluorosis (mottled enamel) -- was prevalent throughout the surrounding El Paso County. The dentist described fluorosis and made recommendations on how to prevent its occurrence (34,35). Other dentists and researchers also had noted the occurrence of fluorosis and theorized that fluoride in the water might be associated with the condition. They also noted that persons who had fluorosis had almost no dental caries (36). The dentist in Colorado subsequently collaborated with the U.S. Public Health Service to determine if fluoride could be added to the drinking water to prevent cavities (2,37). Further studies were conducted that confirmed the cause-and-effect relation between fluoridation and the reduction of dental caries (1,3,6,38,39). National, State, and Local Fluoride Guidelines A public water system can be owned by the municipality that it serves, or it may be corporately owned. A public water system is not defined by its ownership. To be considered a public water system, the system must have greater than or equal to 15 service connections or must regularly serve an average of greater than or equal to 25 persons for greater than or equal to 60 days per year. Public water systems do not necessarily follow city, county, or even state boundaries. For example, a large municipality may be served by one water system or by multiple water systems; a public water system may serve several municipalities. Individual states' regulations and/or guidelines for respective water systems range from specific to general. The recommendations and guidelines for water fluoridation must be sufficiently general to allow for individual states' variations in nomenclature and organization. Schools that have individual water systems, which are considered public water systems, are subject to all the rules that apply to public water systems. However, because of limits on use and the size of these systems, they have been included in a subcategory of public water systems referred to as nontransient, noncommunity public water systems. Special recommendations and guidelines that apply to school public water systems are included in this report. Although no national regulations or laws govern water fluoridation, many federal agencies concur that water fluoridation is beneficial to public health (M. Cook, personal communication; 40). The Environmental Protection Agency (EPA), through the Safe Drinking Water Act of 1986, has established national requirements for public water systems but not for adjusted water fluoridation. EPA also has established a maximum concentration level for natural fluoride in drinking water. If the fluoride content in drinking water exceeds this level, it must be removed. * RECOMMENDATIONS FOR FLUORIDATED COMMUNITY PUBLIC WATER SUPPLY SYSTEMS
Fluoride remains a safe compound when maintained at the optimal level in water supplied to the distribution system; however, an operator might be exposed to excessive levels if proper procedures are not followed or if equipment malfunctions. Thus, the use of personal protective equipment (PPE) is required when fluoride compounds are handled or when maintenance on fluoridation equipment is performed. The employer should develop a written program regarding the use of PPE. The water supply industry has a high incidence of unintentional injuries compared with other industries in the United States; therefore, safety procedures should be followed (48).
RECOMMENDATIONS FOR FLUORIDATED SCHOOL PUBLIC WATER SUPPLY SYSTEMS
School water fluoridation is recommended only when the school has its own source of water and is not connected to a community water system. Each state is responsible for determining whether school water fluoridation is desirable and for effecting a written agreement between the state and appropriate school officials. A school water fluoridation program must not be started unless resources are available at the state level to undertake operational and maintenance responsibilities. For example, one full-time school technician should be assigned to every 25-30 schools. The following recommendations should be implemented for a school water fluoridation program:
Monitoring and Surveillance
Technical Requirements
Safety Procedures Fluoride remains a safe compound when maintained at the optimal level in the water supplied to a school water system; however, the school technician could be exposed to excessive levels if proper procedures are not followed or if equipment malfunctions. Thus, the use of PPE is required when fluoride compounds are handled or when maintenance is performed on fluoridation equipment. The state should develop a written program for schools regarding the use of PPE.
References
Safe Drinking Water Act, 42 U.S.C. &300f et seq, as amended in 1986. Glossary of Technical Terms Adjusted fluoridated water system: A community public water system that adjusts the fluoride concentration in the drinking water to the optimal level for consumption (or within the recommended control range). Calculated dosage: The calculated amount of fluoride (mg/L) that has been added to an adjusted fluoridated water system. The calculation is based on the total amount of fluoride (weight) that was added to the water system and the total amount of water (volume) that was produced. Census designated place: A populated place, not within the limits of an incorporated place, that has been delimited for census purposes by the U.S. Bureau of the Census. Check sample: A distribution water sample forwarded to either the state laboratory or to a state-approved laboratory for analysis. Community: A geographical entity that includes all incorporated places as well as all census-designated places as defined by the U.S. Bureau of the Census. Community public water system (CWS): A public water system that serves at least 15 service connections used by year-round residents or that regularly serves at least 25 year-round residents. Consecutive water system: A public water system that buys water from another public water system. For purposes of water fluoridation record keeping, the consecutive water system should purchase at least 80% of its water from a fluoridated water system. Distribution sample: A water sample taken from the distribution lines of the public water system that is representative of the water quality in the water system. Fluoridated water system: A public water system that produces water that has fluoride from either naturally occurring sources at levels that provide maximum dental benefits, or by adjusting the fluoride level to optimal concentrations. Incorporated place: A populated place possessing legally defined boundaries and legally constituted government functions. Monitoring, fluoride: The regular analysis and recording by water system personnel of the fluoride ion content in the drinking water. Natural fluoride level: The concentration of fluoride (mg/L) that is present in the water source from naturally occurring fluoride sources. Naturally fluoridated water system: A public water system that produces water that has fluoride from naturally occurring sources at levels that provide maximum dental benefits. Nontransient, noncommunity water system (NTNCWS): A public water system that is not a community water system and that regularly serves at least 25 of the same persons more than 6 months per year. Optimal fluoride level: The recommended fluoride concentration (mg/L) based on the annual average of the maximum daily air temperature in the geographical area of the fluoridated water system. Overfeed, fluoride: Any fluoride analytical result above the recommended control range of the water system. Different levels of response are expected from the operator depending on the extent of the overfeed (Table_1 and Table_6). Public water system (PWS): A system that provides piped water to the public for human consumption. To qualify as a public water system, a system must have 15 or more service connections or must regularly serve an average of at least 25 individuals 60 or more days per year. Recommended control range: A range within which adjusted fluoridated water systems should operate to maintain optimal fluoride levels. This range is usually set by state regulation. School technician: A state employee (usually from either the dental or drinking water program) whose primary responsibility is to provide for site visits, assist in the training of school fluoridation monitors, provide surveillance of all fluoridated school water systems, and resolve problems. This person functions as the water plant operator for a school fluoridation system and may be either an engineer or a technician. School water system: A nontransient, noncommunity water system that serves only a school. Split sample: A distribution water sample taken by the water plant operator, who analyzes a portion of the sample and records the results on the monthly operating report to the state. The operator then forwards the remainder of the sample to the state laboratory or to a state-approved laboratory for analysis. State: This term includes the 50 contiguous states and U.S. territories. State fluoridation administrator: A state employee (usually from either the dental or drinking water program) who is responsible for the administration of the fluoridation program. State fluoridation specialist: A state employee (usually from either the dental or drinking water program) whose primary responsibility is to provide for site visits, assist in the training of water plant operators, provide surveillance of all fluoridated water systems, and resolve problems. This person may be either an engineer or a technician. Surveillance, fluoride: The regular review of monitored data and split sample or check sample results to ensure that fluoride levels are maintained by the community water systems in a specific geographic area. The review is conducted by a source independent of the water system. Uniform flow: When the rate of flow of the water past a point varies by less than 20%. Upstream: In a water line, a point closer to the source of water. Water, make-up: Water that is used to replace the saturated solution from a sodium fluoride saturator; this saturated solution is pumped into the distribution lines. Water fluoridation: The act of adjusting the fluoride concentration in the drinking water of a water system to the optimal level. Exhibit A The Association of State and Territorial Dental Directors Instructions for Completing Fluoridation Quarterly Report for Community and School Water Systems Table_A1 Table_A2 Table_A3 Table_A4 Table_A5 Table_A6 Exhibit B Fluoridation Facility Fact Sheet Figure_B1 Figure_B2 Figure_B3 Figure_B4 Figure_B5 Figure_B6 Exhibit C Fluoridation Facility Inspection Report Table_1 Note: To print large tables and graphs users may have to change their printer settings to landscape and use a small font size.
TABLE 1.  Recommended fluoride overfeed actions for community water systems, United States (31)
=============================================================================================================
Fluoride level                                  Actions Recommended
-------------------------------------------------------------------------------------------------------------
0.1 mg/L above control range * to 2.0 mg/L      1. Leave the fluoridation system on.
                                                2. Determine malfunction and repair.

2.1 mg/L to 4.0 mg/L                            1. Leave the fluoridation system on.
                                                2. Determine malfunction and repair.
                                                3. Notify supervisor and report the incident to the
                                                   appropriate county or state agencies.

4.1 mg/L to 10.0 mg/L                           1. Determine malfunction and immediately
                                                   attempt repair.
                                                2. If the problem is not found and corrected quickly,
                                                   turn off the fluoridation system.
                                                3. Notify supervisor and report the incident to the
                                                   appropriate county or state agencies.
                                                4. Take water samples at several points in the
                                                   distribution system and test the fluoride content.
                                                   Retest if results are still high.
                                                5. Determine malfunction and repair. Then, with
                                                   supervisor's permission, restart the fluoridation
                                                   system.

10.1 mg/L or greater +                          1. Turn off the fluoridation system
                                                   immediately.
                                                2. Notify supervisor and report the incident
                                                   immediately to the appropriate county or state
                                                   agencies and follow their instructions.
                                                3. Take water samples at several points in the
                                                   distribution system and test the fluoride content.
                                                   Retest if results are still high. Save part of each
                                                   sample for the state laboratory to test.
                                                4. Determine malfunction and repair. Then, with
                                                   supervisor's and the state's permission, restart
                                                   the fluoridation system.
-------------------------------------------------------------------------------------------------------------
* See control ranges in Table 2.
+ The state might require public notification to prevent consumption of high levels of fluoridated water.
=============================================================================================================
Return to top. Table_2 Note: To print large tables and graphs users may have to change their printer settings to landscape and use a small font size.
TABLE 2.  Recommended optimal fluoride levels for community public water supply systems (31,32)
===================================================================================================
Annual average of maximum daily         Recommended           Recommended control range
    air temperatures (8,9)                fluoride                  (mg/L) 0.1-0.5
-------------------------------        concentrations         -------------------------
     F                  C                  (mg/L)              Below           Above
---------------------------------------------------------------------------------------------------
50.0-53.7         10.0-12.0               1.2                   1.1             1.7
53.8-58.3         12.1-14.6               1.1                   1.0             1.6
58.4-63.8         14.7-17.7               1.0                   0.9             1.5
63.9-70.6         17.8-21.4               0.9                   0.8             1.4
70.7-79.2         21.5-26.2               0.8                   0.7             1.3
79.3-90.5         26.3-32.5               0.7                   0.6             1.2
---------------------------------------------------------------------------------------------------
* Based on temperature data obtained for a minimum of 5 years.
===================================================================================================
Return to top. Table_3 Note: To print large tables and graphs users may have to change their printer settings to landscape and use a small font size.
TABLE 3. Recommended emergency treatment for persons who ingest dry fluoride chemicals (NaF and Na2SiF6) (60)
===============================================================================================================
Milligrams fluoride ion (mg) ingested per
  body weight (kg) *                               Treatment
---------------------------------------------------------------------------------------------------------------
<5.0 mg of fluoride ion/kg +                       1. Give calcium (milk) orally to relieve
                                                      gastrointestinal symptoms. Observe for 2-4
                                                      hours. (A can of evaporated milk should
                                                      be available at all times to use for
                                                      emergency treatment.)
                                                   2. Induced vomiting is not necessary.

>=5.0 mg of fluoride ion/kg                        1. Move the person away from any
                                                      contact with fluoride and keep him or her
                                                      warm.
                                                   2. Call the Poison Control Center.
                                                   3. If the person is conscious, induce vomiting
                                                      by rubbing the back of the person's throat
                                                      with either a spoon or your finger or giving
                                                      the person syrup of ipecac. To prevent
                                                      aspiration of vomitus, the person should be
                                                      placed face down with the head lower than the body.
                                                   4. Give the person a glass of milk or any
                                                      source of soluble calcium (i.e., 5% calcium
                                                      gluconate or calcium lactate solution).
                                                   5. Take the person to the hospital as quickly
                                                      as possible.
---------------------------------------------------------------------------------------------------------------
* Average weight/age: 0-15 kg/0-2 years; 15-20 kg/3-5 years; 20-23 kg/6-8 years; 23-23-45 kg/9-15 years;
  45-70 kg and higher/15-21 years and older.
+ 5 mg of fluoride (F) equals 11 mg of sodium fluoride (8 mg of sodium fluorosilicate). Ingesting 5 mg
  F/kg is equivalent to a l54-lb. (70 kg) person consuming 0.8 grams of sodium fluoride (0.6 grams of sodium
  fluorosilicate).
===============================================================================================================
Return to top. Table_4 Note: To print large tables and graphs users may have to change their printer settings to landscape and use a small font size.
TABLE 4. Recommended emergency treatment for persons who ingest fluorosilicic acid (H2SiF6) (60)
===============================================================================================================
Milligrams fluoride ion (mg)
  ingested per body weight (kg) *                  Treatment
---------------------------------------------------------------------------------------------------------------
<5.0 mg fluoride/kg +                              1. Give calcium (milk) orally to relieve
                                                      gastrointestinal symptoms. Observe for 2-4
                                                      hours. (A can of evaporated milk should be
                                                      available at all times to use for emergency
                                                      treatment.)
                                                   2. Induced vomiting is not necessary.

>=5.0 mg fluoride/kg                               1. Move the person away from any contact
                                                      with fluoride and keep him or her warm.
                                                   2. Call the Poison Control Center.
                                                   3. If advised by the Poison Control Center and if
                                                      the person is conscious, induce vomiting by
                                                      rubbing the back of the person's throat with
                                                      a spoon or your finger or use syrup of ipecac.
                                                      To prevent aspiration of vomitus, the person
                                                      should be placed face down with the head lower than the
                                                      body.
                                                   4. Give the person a glass of milk or any source
                                                      of soluble calcium (i.e., 5% calcium gluconate
                                                      or calcium lactate solution).
                                                   5. Take the person to the hospital as quickly as
                                                      possible. It is important that whoever takes
                                                      the person to the hospital notify physicians
                                                      that the person is at risk for pulmonary edema
                                                      as late as 48 hours afterward.
---------------------------------------------------------------------------------------------------------------
* Average weight/age: 0-15 kg/0-2 years; 15-20 kg/3-5 years; 20-23 kg/6-8 years; 23-45 kg/9-15 years; 45-70 kg
  and higher/15-21 years and older.
+ 5 mg of fluoride (F) equals 27 mg of 23% fluorosilicic acid. Ingesting 5 mg F/kg is equivalent to a l54-lb.
  (70 kg) person consuming 2 grams of fluorosilicic acid.
===============================================================================================================
Return to top. Table_5 Note: To print large tables and graphs users may have to change their printer settings to landscape and use a small font size.
TABLE 5. Recommended optimal fluoride levels for school public water supply systems (31,32)
=============================================================================================
Annual average of maximum daily     Recommended
  air temperatures (8,9)              fluoride        Recommended control range (mg/L)
--------------------------------   concentrations     --------------------------------
     F                  C              (mg/L)          20% Below            20% Above
---------------------------------------------------------------------------------------------
50.0-53.7         10.0-12.0            5.4              4.3                  6.5
53.8-58.3         12.1-14.6            5.0              4.0                  6.0
58.4-63.8         14.7-17.7            4.5              3.6                  5.4
63.9-70.6         17.8-21.4            4.1              3.3                  4.9
70.7-79.2         21.5-26.2            3.6              2.9                  4.3
79.3-90.5         26.3-32.5            3.2              2.6                  3.8
---------------------------------------------------------------------------------------------
* Based on temperature data obtained for a minimum of 5 years.
+ Based on 4.5 times the optimal fluoride level for communities.
=============================================================================================
Return to top. Table_6 Note: To print large tables and graphs users may have to change their printer settings to landscape and use a small font size.
TABLE 6.  Recommended fluoride overfeed actions for school public water supply systems (31)
==========================================================================================================
Fluoride level                          Actions recommended
----------------------------------------------------------------------------------------------------------
0.1 mg/L above recommended control      1. Turn off the fluoridation system
  range * to 10.0 mg/L                     immediately.
                                        2. Notify state technician.
                                        3. Notify supervisor.
                                        4. Take water samples at several points in the school and
                                           hold the samples for the state technician.
                                        5. Follow advice of the state technician.

10.l mg/L or higher                     1. Turn off the fluoridation system immediately.
                                        2. Notify state technician.
                                        3. Notify supervisor.
                                        4. Take water samples at several points in the distribution
                                           system and hold samples for the state technician.
                                        5. Prevent the consumption of high levels of fluoridated water.
                                        6. Follow advice of the state technician.
----------------------------------------------------------------------------------------------------------
* See Table 5 for the recommended control range.
==========================================================================================================
Return to top. Table_A1 Note: To print large tables and graphs users may have to change their printer settings to landscape and use a small font size.
Introduction

The purpose of this report is to provide data in summary form to
describe the quality of fluoridation in each state as determined by the
ability of fluoridating systems to conduct monitoring and maintain
optimal fluoride levels.

General Instructions

1. All community water systems in the state that adjust the fluoride
   concentrations of their drinking water supply should be included in this
   report.

2. The optimal fluoride level for a particular system is to be based on
   the annual average of maximum daily air temperature for the geographic
   area over a 5-year period.

Instructions for Completing Form

Item 1. Record the state name.

Item 2. Enter the quarter covered by the report. The reporting period is the
        3-month quarter beginning in January, April, July, or October. Reports
        are requested within 60 days after the end of reporting period.

Item 3. Provide an update on the following:

        A. Record previous quarter's total systems and population.

        B. The names of systems that began fluoridating during the quarter,
           date started, and the total population served.

        C. The names of systems that discontinued fluoridating during the
           quarter, date discontinued, and the population that was served.

        NOTE: This does not include systems with temporary interruption of
        service. These fall into Item 4 or Item 5.

        D. The total number of fluoridated systems at the end of the quarter
           and the total population served.

Item 4. Report the total number of systems and population served that did not
        report required sampling in any month of the reporting period as
        determined by either or both of the following criteria:
Return to top. Table_A2 Note: To print large tables and graphs users may have to change their printer settings to landscape and use a small font size.
        a. Split/check Samples (check samples are acceptable if split samples
           are not available) should be included on the report if every
           quarterly or monthly split sample was not submitted.

        b. Monitoring Reports - For systems required to monitor daily by the
           state, monitoring results were reported for less than 75 percent of
           days water was pumped; or for systems required to monitor less
           frequently, at least one monitoring result per week was not
           reported.

Item 5. Report the total number of systems and population served that failed
        to maintain optimal fluoride levels because of either of the following:

        a. The mean of all fluoride verification samples, for each system, was
           more than 0.1 ppm below or 0.5 ppm above the optimal fluoride level
           for the system.

        b. More than 25 percent of the monitoring samples, for each system,
           were more than 0.1 ppm below or 0.5 ppm above the optimal level
           (outliers). Report the number of systems and the population in
           this category.

        NOTE: Systems that fail to maintain optimal levels should only be in
        Item 4 or Item 5-NOT BOTH.

Item 6. Report total number of systems and population served that have
        maintained optimal levels for all 3 months in the quarter. Do not
        include systems falling into Item 4 or Item 5 above.

        Note: Items 4, 5, and 6 must equal End of Quarter total Item 3D.

Item 7. Report total number of systems and population served that had more
        than one-third of the split/check samples taken in the quarter
        deviating by more than plus or minus 0.2 ppm from the corresponding
        monitoring results.

        Note: Systems included in this item may also be included in Items 4,
        5, and 6.
Return to top. Table_A3 Note: To print large tables and graphs users may have to change their printer settings to landscape and use a small font size.
FLUORIDATION QUARTERLY REPORT COMMUNITY WATER SYSTEMS
----------------------------------------------------------------

1. STATE: _________________2. REPORTING PERIOD: _______________
-----------------------------------------------------------------
3. END OF QUARTER STATISTICS:

   A: Last Quarter Total Systems:________ Population:__________

   B: Began During Quarter (one line)

     NAMES          DATE STARTED      POPULATION SERVED
_______________ ____________________ ___________________
_______________ ____________________ ___________________
_______________ ____________________ ___________________
_______________ ____________________ ___________________
_______________ ____________________ ___________________
_______________ ____________________ ___________________

C: Discontinued During Quarter

     NAMES         DATE DISCONT.      POPULATION SERVED
_______________ ____________________ ___________________
_______________ ____________________ ___________________
_______________ ____________________ ___________________
_______________ ____________________ ___________________

D: Total Systems Fluoridating

End of Quarter Total Systems:_______ Population:_________
-----------------------------------------------------------------
4. SUMMARY OF SYSTEMS WITH INCOMPLETE DATA

Number of Systems: __________ Population Served: ___________
-----------------------------------------------------------------
5. SUMMARY OF SYSTEMS NOT MEETING OPTIMAL LEVELS
Number of Systems: __________ Population Served: ___________
-----------------------------------------------------------------
6. SUMMARY OF SYSTEMS MEETING OPTIMAL LEVELS
Number of Systems: __________ Population Served: ___________
-----------------------------------------------------------------
7. SYSTEMS WITH INADEQUATE CORRELATION BETWEEN CHECK SAMPLES AND
MONITORING RESULTS
Number of Systems: __________ Population Served: ___________
-----------------------------------------------------------------
Person Completing
Form:___________________Telephone______________
Return to top. Table_A4 Note: To print large tables and graphs users may have to change their printer settings to landscape and use a small font size.
Introduction

The purpose of this report is to provide data in summary form to
describe the quality of fluoridation in each state as determined
by the ability of fluoridating schools to conduct monitoring and
maintain optimal fluoride levels.

General Instructions

1. All school water systems in the state that adjust the
   fluoride concentrations of their drinking water supply should be
   included in this report.

2. The optimal fluoride level for a particular system is to be
   based on the annual average of maximum daily air temperature for
   the geographic area over a 5-year period. This optimal fluoride
   level is the community optimal level multiplied by 4.5 for use
   in schools.

Instructions for Completing Form

Item 1. Record the state name.

Item 2. Enter the quarter covered by the report. The reporting
        period is the 3-month quarter beginning in October, January, and
        April. Reports are requested within 60 days after the end of
        reporting period.

Item 3. Provide an update on the following:

        A. Record previous quarter's total schools and population.

        B. The names of schools that began fluoridating during the quarter,
           date started, and the total population served.

        C. The names of schools that discontinued fluoridating during the
           quarter, date discontinued, and the population that was served.

        NOTE: This does not include schools with temporary interruption of
        service. These fall into Item 4 or Item 5.

        D. The total number of fluoridated schools at the end of the quarter
           and the total population served.

Item 4. Report the total number of schools and population served that did
        not report required sampling in any month of the reporting period as
        determined by either or both of the following criteria:
Return to top. Table_A5 Note: To print large tables and graphs users may have to change their printer settings to landscape and use a small font size.
        a. Verification Sample - a school should be included on the
           report if every weekly verification sample was not submitted.

        b. Monitoring Reports - For systems required to monitor daily by
           the state, monitoring results were reported for less than 75
           percent of days water was pumped; or for systems required to
           monitor less frequently, at least one monitoring result per week
           was not reported.

Item 5. Report the total number of systems and population served
        that failed to maintain optimal fluoride levels because of
        either of the following:

        a. The mean of all fluoride verification samples, for each
           school, was more than 0.5 ppm below or 1.5 ppm above the optimal
           fluoride level for the system.

        b. More than 25 percent of the monitoring samples, for each
           school, were more than 0.5 ppm below or 1.5 ppm above the
           optimal level (outliers). Report the number of systems and the
           population in this category.

        NOTE: Schools that fail to maintain optimal levels should only
        be in Item 4 or Item 5--NOT BOTH.

Item 6. Report total number of schools and population served
        that have maintained optimal levels for all 3 months in the
        quarter.

        Do not include schools falling into Item 4 or Item 5 above.

        Note: Items 4, 5, and 6 must equal End of Quarter total Item 3D.
Return to top. Table_A6 Note: To print large tables and graphs users may have to change their printer settings to landscape and use a small font size.
FLUORIDATION QUARTERLY REPORT SCHOOL WATER SYSTEMS
-----------------------------------------------------------------
1. STATE: _________________ 2. REPORTING PERIOD:_______________
-----------------------------------------------------------------
3. END OF QUARTER STATISTICS:

A: Last Quarter Total Schools:________ Population:__________

B: Began During Quarter (one line)

    NAMES           DATE STARTED      POPULATION SERVED
_______________ ____________________ ___________________
_______________ ____________________ ___________________
_______________ ____________________ ___________________
_______________ ____________________ ___________________
_______________ ____________________ ___________________
_______________ ____________________ ___________________

C: Discontinued During Quarter

     NAMES          DATE DISCONT.     POPULATION SERVED
_______________ ____________________ ___________________
_______________ ____________________ ___________________
_______________ ____________________ ___________________
_______________ ____________________ ___________________

D: Total Schools Fluoridating

End of Quarter Total Schools:_______ Population:_________
-----------------------------------------------------------------
4.SUMMARY OF SCHOOLS WITH INCOMPLETE DATA
Number of Schools: __________ Population Served: ___________
-----------------------------------------------------------------
5. SUMMARY OF SCHOOLS NOT MEETING OPTIMAL LEVELS
Number of Schools: __________ Population Served: ___________
-----------------------------------------------------------------
6. SUMMARY OF SCHOOLS MEETING OPTIMAL LEVELS
Number of Schools: __________ Population Served: ___________
-----------------------------------------------------------------
Person Completing
Form:___________________Telephone______________
Return to top. Figure_B1 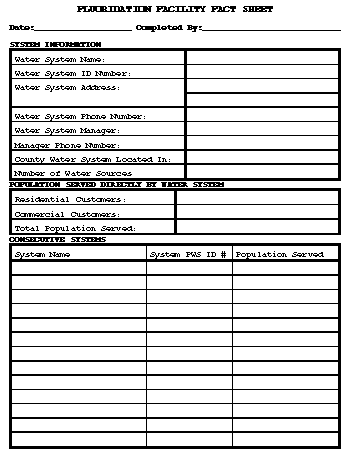 Return to top. Figure_B2 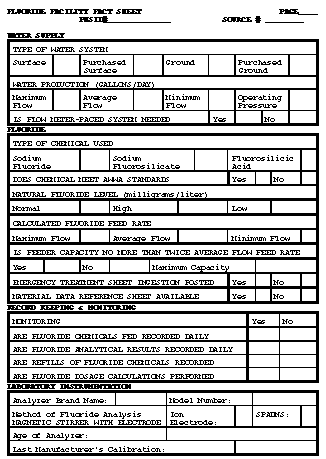 Return to top. Figure_B3 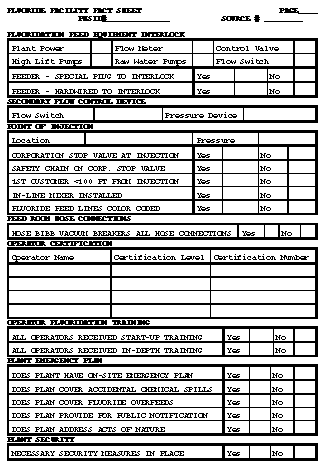 Return to top. Figure_B4 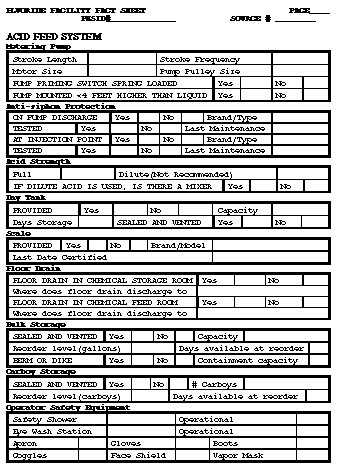 Return to top. Figure_B5 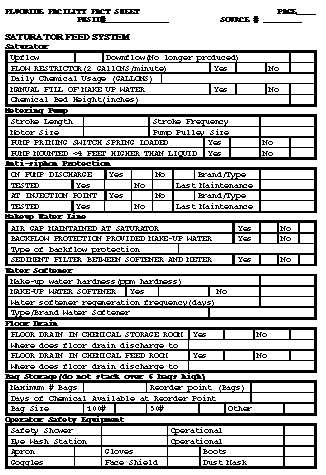 Return to top. Figure_B6 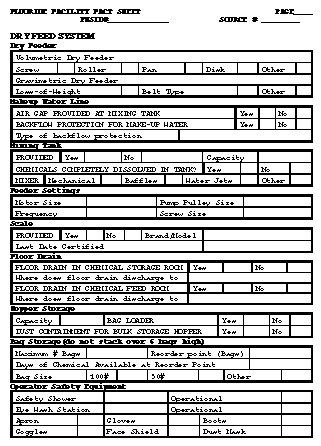 Return to top. Figure_C1 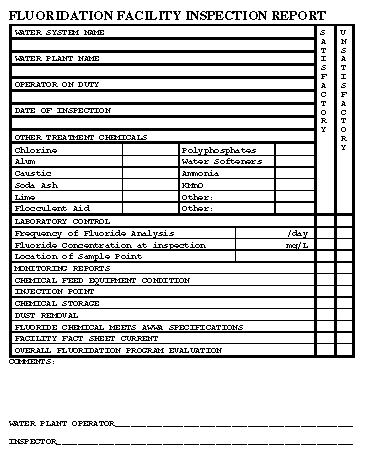 Return to top. Disclaimer All MMWR HTML versions of articles are electronic conversions from ASCII text into HTML. This conversion may have resulted in character translation or format errors in the HTML version. Users should not rely on this HTML document, but are referred to the electronic PDF version and/or the original MMWR paper copy for the official text, figures, and tables. An original paper copy of this issue can be obtained from the Superintendent of Documents, U.S. Government Printing Office (GPO), Washington, DC 20402-9371; telephone: (202) 512-1800. Contact GPO for current prices. **Questions or messages regarding errors in formatting should be addressed to mmwrq@cdc.gov.Page converted: 09/19/98 |
|||||||||
This page last reviewed 5/2/01
|