 |
|
|
|
|
|
|
| ||||||||||
|
|
|
|
|
|
|
||||
| ||||||||||
|
|
|
|
|
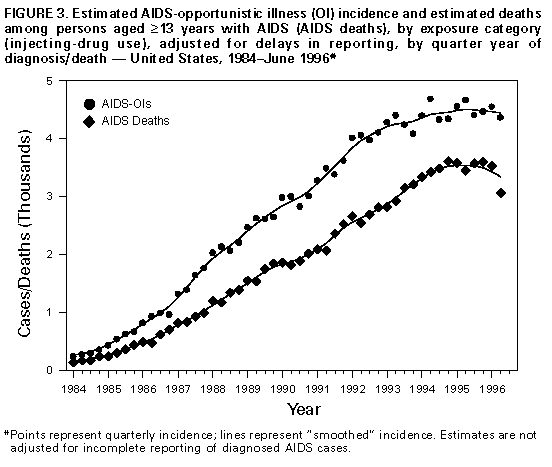
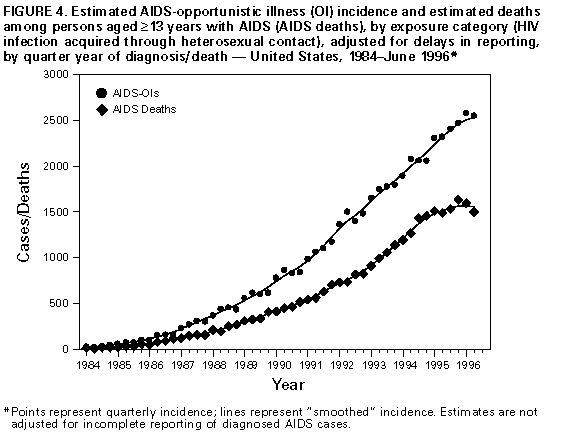
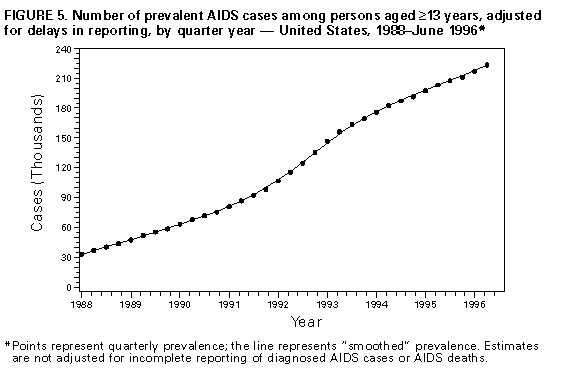
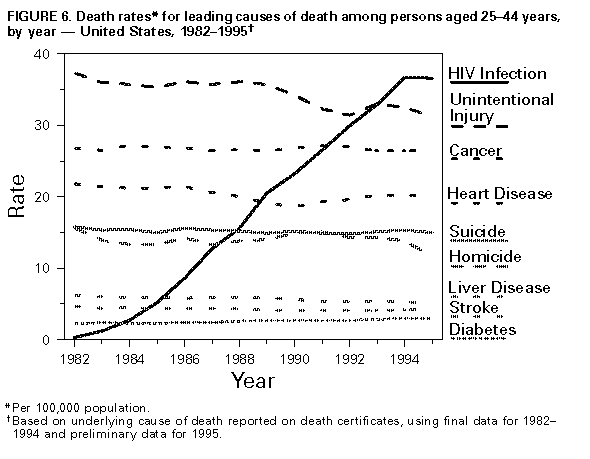
Persons using assistive technology might not be able to fully access information in this file. For assistance, please send e-mail to: mmwrq@cdc.gov. Type 508 Accommodation and the title of the report in the subject line of e-mail. Update: Trends in AIDS Incidence, Deaths, and Prevalence -- United States, 1996bloodborne pathogens (MMWR 1988;37:377-82, 387-8 and MMWR 1987;36{no. S2}). The national acquired immunodeficiency syndrome (AIDS) surveillance system is used to describe the impact of HIV-related morbidity and death in the United States. This report presents trends in AIDS incidence during 1996 and describes recent declines in deaths among persons reported with AIDS (AIDS deaths) and increases in AIDS prevalence. * Cumulative AIDS cases among persons aged greater than or equal to 13 years reported to CDC based on the 1993 expanded surveillance case definition from the 50 states, the District of Columbia, Puerto Rico, and the U.S. territories were analyzed by year of report, race/ethnicity, and mode of risk/exposure (1). Estimates of AIDS incidence and deaths were adjusted for the effects of delays in reporting. For analyses by mode of risk/exposure, estimates were adjusted for the anticipated reclassification of cases initially reported without an HIV risk/exposure (1). To adjust for the expansion of the reporting criteria in 1993, estimates of the incidence of AIDS-opportunistic illnesses (OIs) were calculated from the sum of cases diagnosed with an AIDS-OI and the estimated dates of an AIDS-OI diagnosis for cases reported based on immunologic criteria ** (1). AIDS-OI incidence was estimated quarterly through June 1996, the most recent period for which reliable estimates were available. Estimates of AIDS-OI incidence rates per 100,000 population were based on 1995 population estimates from the Bureau of the Census. Deaths among persons with AIDS were identified by review of medical records and death certificates and include both deaths from AIDS and from other causes. AIDS prevalence was estimated from cumulative AIDS incidence minus cumulative deaths. Reported AIDS Cases From 1981 through 1996, a total of 573,800 persons aged greater than or equal to 13 years with AIDS were reported to CDC by state and local health departments (Table_1). The expansion of the AIDS surveillance case definition in 1993 resulted in a large increase in reported cases during 1993 followed by declines in numbers of AIDS cases reported each year from 1994 through 1996. The 68,473 AIDS cases reported during 1996 was substantially higher (47%) than the number reported during 1992. From 1992 through 1996, non-Hispanic blacks, Hispanics, and women accounted for increasing proportions of persons reported with AIDS. In 1996, non-Hispanic blacks accounted for 41% of adults reported with AIDS, exceeding for the first time the proportion who were non-Hispanic white, and women accounted for an all-time high of 20% of adults reported with AIDS. AIDS-OI Incidence In 1995, AIDS-OIs were diagnosed in an estimated 62,200 persons, an increase of 2% over the estimate for 1994 (61,200) (Figure_1). From January 1994 through June 1996, the quarterly incidence of AIDS-OIs was stable (mean: 15,200 cases per quarter). During 1995, estimated AIDS-OI incidence rates per 100,000 population were approximately sevenfold higher among non-Hispanic blacks (99) and threefold higher among Hispanics (50) than among non-Hispanic whites (15). Estimated rates were lowest among American Indians/Alaskan Natives (14) and Asians/Pacific Islanders (6) and were nearly five-fold greater among men (48) than among women (10). From 1994 through 1995, estimated AIDS-OI incidence was approximately constant (a decrease of 2%) among men who have sex with men (MSM) (Figure_2) and among heterosexual injecting-drug users (IDUs) (an increase of 2%) (Figure_3), but increased substantially among persons infected through heterosexual contact (17%) (Figure_4). Of the 30,100 persons in whom AIDS-OIs were diagnosed during January-June 1996, 46% were MSM, 29% were IDUs, and 17% were infected through heterosexual contact. Deaths Among Persons Reported with AIDS The estimated number of deaths among persons reported with AIDS increased steadily through 1994 (approximately 49,600 deaths among persons with AIDS during 1994) (Figure_1) but increased only slightly in 1995 (approximately 50,000 deaths). During January-June 1996, the estimated number of AIDS deaths (22,000) was 13% less than that estimated during January-June 1995 (24,900), and the number of deaths declined in each of the four regions of the United States (Northeast {15%}, South {8%}, Midwest {11%}, and West {16%}) ***. The number of AIDS deaths also declined among all racial/ethnic groups (non-Hispanic whites {21%}, non-Hispanic blacks {2%}, Hispanics {10%}, Asians/Pacific Islanders {6%}, and American Indians/Alaskan Natives {32%}) and among men (15%) but increased 3% among women. By risk/exposure category, deaths declined 18% among MSM (Figure_2) and 6% among IDUs (Figure_3) but increased 3% among persons infected through heterosexual contact (Figure_4), the only risk/exposure group with large increases in AIDS-OI incidence during 1995. AIDS Prevalence As of June 1996, the estimated prevalence of AIDS was 223,000 U.S. residents aged greater than or equal to 13 years (Figure_5), representing increases of 10% and 65% since mid-1995 and January 1993, respectively. Of prevalent cases of AIDS, 82% were among men; 43%, non-Hispanic whites; 38%, non-Hispanic blacks; and 19%, Hispanics. By risk/exposure category, MSM accounted for the largest number of prevalent cases of AIDS (44%), followed by IDUs (26%) and persons infected through heterosexual contact (12%); all other risk/exposure groups **** combined accounted for 18% of prevalent cases of AIDS. The largest proportionate increase in AIDS prevalence from June 1995 through June 1996 occurred among persons infected through heterosexual contact (19%) while the largest absolute increase occurred among MSM (5100). Reported by: State and local health depts. Div of HIV/AIDS Prevention -- Surveillance and Epidemiology, National Center for HIV, STD, and TB Prevention, CDC. Editorial NoteEditorial Note: The findings in this report document a substantial increase in AIDS prevalence in the United States. Prevalence is a function of both the rate of new infections and the duration of illness. The increase in AIDS prevalence reflects declines in AIDS deaths and stable AIDS incidence. The increased prevalence of AIDS indicates the need for medical and other services for persons with HIV infection and for prevention programs to reduce the number of persons becoming infected with HIV. The leveling of AIDS-OI incidence nationally in 1995 was preceded by a gradual deceleration in the rate of increase of new AIDS diagnoses during previous years (1). Similar trends have been documented among MSM and IDUs in clinic-based HIV-seroprevalence surveys (2). However, the incidence of cases associated with heterosexual contact has continued to increase, primarily reflecting transmission from the large population of IDUs with HIV/AIDS to their heterosexual partners. For the first time, deaths among persons with AIDS have decreased substantially. This finding is consistent with recent reports, based on death-certificate data, of declines in deaths from HIV infection in New York City (3) and nationally (4). Despite these trends, during 1995 HIV infection remained the leading cause of death among persons aged 25-44 years (Figure_6), accounting for 19% of deaths from all causes in this age group. The decrease in AIDS deaths reflects both the leveling of AIDS-OI incidence and improved survival among persons with AIDS. Increased survival reflects recent improvements in medical care, the use of combination therapy with antiretroviral agents, and increasing use of prophylactic drugs to prevent secondary AIDS-OIs (5). In addition, the widespread availability of protease inhibitors, approved by the Food and Drug Administration in 1996, may further improve survival (6). The higher AIDS-OI incidence rates among non-Hispanic blacks and Hispanics than among non-Hispanic whites may reflect reduced access to health care associated with disadvantaged socioeconomic status, cultural or language barriers that may limit access to prevention information, and differences in HIV risk behaviors (7). The number of AIDS deaths did not decrease among women or persons infected through heterosexual contact, reflecting, in part, continued increases in AIDS incidence and differences in access to treatment, which may vary by sex, region, race/ethnicity, and risk/exposure. To assist prevention efforts and treatment services, surveillance systems are being developed to assess access to counseling, testing, and care. Monitoring AIDS prevalence will help direct resources to persons most in need of treatment for severe HIV disease. However, because the clinical status of most HIV-infected persons has not yet progressed to AIDS (8), AIDS prevalence underestimates the total number of HIV-infected persons in need of related services. Advances in treatment and improved survival also will affect efforts to monitor the HIV epidemic based on the current AIDS surveillance definition and, therefore, will require surveillance systems that are less sensitive to changes in the progression of HIV disease. Among the 26 states that conducted surveillance for cases of both HIV infection and AIDS in 1996, prevalence of HIV and AIDS among reported cases (126,491) was 2.5-fold higher than the prevalence of AIDS (51,217) (1). However, this represents a minimum estimate of HIV prevalence in these states because not all HIV-infected persons seek testing and some persons are tested anonymously. The Council of State and Territorial Epidemiologists has recommended that all states consider implementing surveillance for HIV infection and AIDS (9). Population-based surveillance for both HIV and AIDS provides a more complete measure of the number of HIV-infected persons and a more timely measure to detect emerging patterns of HIV transmission than does AIDS surveillance alone. CDC provides technical assistance and funding to areas that conduct both HIV and AIDS case surveillance. CDC also supports research to develop optimal surveillance methods that meet the need for important behavioral, biomedical, and treatment data for persons with HIV and AIDS and that address public health and community concerns about factors that may influence decision-making regarding testing or treatment. Future trends in the HIV/AIDS epidemic in the United States will reflect the effectiveness of programs to prevent new HIV infections, to promote timely diagnosis, and to continue improving clinical management. CDC has established as a primary prevention strategy efforts to involve affected communities in planning and evaluating HIV-prevention programs (10). To continue to provide data for planning, directing, and evaluating HIV prevention and care services at the federal, state, and local levels, HIV/AIDS surveillance systems must adapt to changes in the diagnosis and clinical management of HIV and AIDS. References
* Single copies of this report will be available until February 28, 1998, from the CDC National AIDS Clearinghouse, P.O. Box 6003, Rockville, MD 20849-6003; telephone (800) 458-5231 or (301) 217-0023. ** The immunologic criteria that were added to the AIDS case definition in 1993 were CD4+ T-lymphocyte count less than 200 cells/uL or CD4+ T-lymphocyte percentage of total lymphocytes of less than 14. *** Northeast=Connecticut, Maine, Massachusetts, New Hampshire, New Jersey, New York, Pennsylvania, Rhode Island, and Vermont; Midwest=Illinois, Indiana, Iowa, Kansas, Michigan, Minnesota, Missouri, Nebraska, North Dakota, Ohio, South Dakota, and Wisconsin; South=Alabama, Arkansas, Delaware, District of Columbia, Florida, Georgia, Kentucky, Louisiana, Maryland, Mississippi, North Carolina, Oklahoma, South Carolina, Tennessee, Texas, Virginia, and West Virginia; and West=Alaska, Arizona, California, Colorado, Hawaii, Idaho, Montana, Nevada, New Mexico, Oregon, Utah, Washington, and Wyoming. **** Includes men who reported both having sex with men and injecting-drug use, persons with hemophilia/coagulation disorders, transfusion recipients, and persons with other or no risks reported. Table_1 Note: To print large tables and graphs users may have to change their printer settings to landscape and use a small font size.
TABLE 1. Number and percentage of persons aged >=13 years reported with AIDS, by sex and race/ethnicity -- United States, 1981-1996
============================================================================================================================================================
                                                                                   Year of report
                                          ------------------------------------------------------------------------------------------------------------------
                                                1992             1993 *            1994               1995              1996                1981-1996
                                          --------------    ---------------   ---------------   ----------------   --------------      ---------------------
Characteristic                               No.     (%)       No.      (%)      No.      (%)      No.       (%)      No.     (%)           No.      (%)
------------------------------------------------------------------------------------------------------------------------------------------------------------
Sex
 Male                                     40,330   ( 86)    87,945    ( 84)   64,730    ( 82)   59,285     ( 81)   54,653   ( 80)       488,300    ( 85)
 Female                                    6,307   ( 14)    16,671    ( 16)   13,830    ( 18)   13,682     ( 19)   13,820   ( 20)        85,500    ( 15)
Race/Ethnicity
 White, non-Hispanic                      22,320   ( 48)    47,468    ( 45)   32,677    ( 42)   29,402     ( 40)   26,229   ( 38)       267,487    ( 47)
 Black, non-Hispanic                      15,576   ( 33)    37,523    ( 36)   30,373    ( 39)   28,729     ( 39)   28,346   ( 41)       198,780    ( 35)
 Hispanic                                  8,223   ( 18)    18,410    ( 18)   14,612    ( 19)   13,961     ( 19)   12,966   ( 19)       101,253    ( 18)
 Asian/Pacific Islander                      334   ( <1)       761    ( <1)      573    ( <1)      558     ( <1)      561   ( <1)         4,090    ( <1)
 American Indian/ Alaskan                    121   ( <1)       369    ( <1)      246    ( <1)      237     ( <1)      207   ( <1)         1,544    ( <1)
Native

Total +                                   46,637   (100)   104,616    (100)   78,560    (100)   72,967     (100)   68,473   (100)       573,800    (100)
------------------------------------------------------------------------------------------------------------------------------------------------------------
* Year the expanded AIDS surveillance case definition was implemented.
+ Totals include persons with unknown or missing race/ethnicity.
============================================================================================================================================================
Return to top. Figure_1  Return to top. Figure_2  Return to top. Figure_3  Return to top. Figure_4  Return to top. Figure_5  Return to top. Figure_6  Return to top. Disclaimer All MMWR HTML versions of articles are electronic conversions from ASCII text into HTML. This conversion may have resulted in character translation or format errors in the HTML version. Users should not rely on this HTML document, but are referred to the electronic PDF version and/or the original MMWR paper copy for the official text, figures, and tables. An original paper copy of this issue can be obtained from the Superintendent of Documents, U.S. Government Printing Office (GPO), Washington, DC 20402-9371; telephone: (202) 512-1800. Contact GPO for current prices. **Questions or messages regarding errors in formatting should be addressed to mmwrq@cdc.gov.Page converted: 09/19/98 |
|||||||||
This page last reviewed 5/2/01
|