 |
|
|
|
|
|
|
| ||||||||||
|
|
|
|
|
|
|
||||
| ||||||||||
|
|
|
|
|
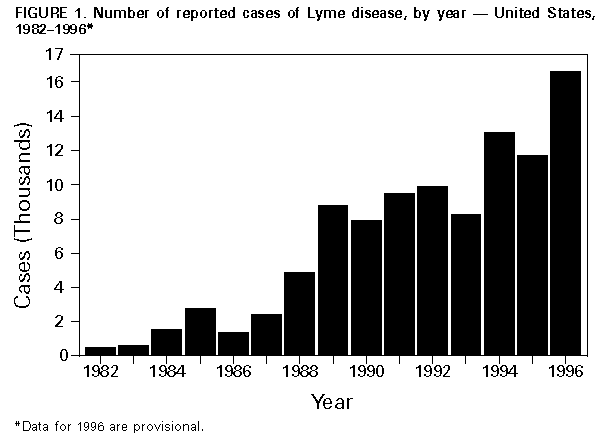
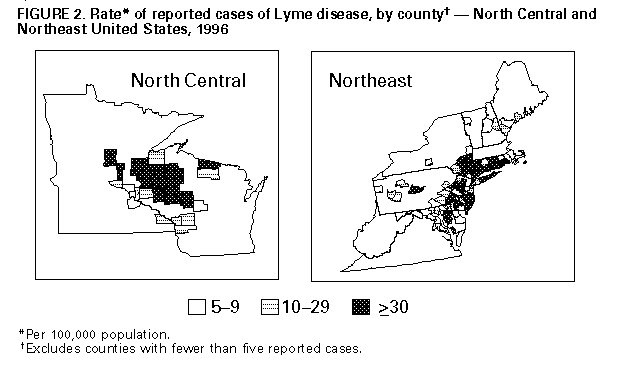
Persons using assistive technology might not be able to fully access information in this file. For assistance, please send e-mail to: mmwrq@cdc.gov. Type 508 Accommodation and the title of the report in the subject line of e-mail. Lyme Disease -- United States, 1996Lyme disease (LD) is caused by the tickborne spirochete Borrelia burgdorferi sensu lato and is the most common vectorborne disease in the United States. Surveillance for LD was initiated by CDC in 1982, and the Council of State and Territorial Epidemiologists designated it a nationally notifiable disease in January 1991. For surveillance purposes, LD is defined as the presence of an erythema migrans rash greater than or equal to 5 cm in diameter or laboratory confirmation of infection with evidence of at least one manifestation of musculoskeletal, neurologic, or cardiovascular disease (1). This report summarizes the provisional number of cases of LD reported to CDC during 1996 and indicates that the number of cases reported to CDC was a record high. In 1996, a total of 16,461 cases of LD were reported to CDC by 45 states and the District of Columbia (overall incidence: 6.2 per 100,000 population *), representing a 41% increase from the 11,700 cases reported in 1995 and a 26% increase from the 13,043 cases reported in 1994 (Figure_1). As in previous years, most cases were reported from the Mid-Atlantic, Northeast, and North Central regions (Table_1). Eight states reported LD incidences that were higher than the overall national rate (Connecticut, 94.8; Rhode Island, 53.9; New York, 29.2; New Jersey, 27.4; Delaware, 23.9; Pennsylvania, 23.3; Maryland, 8.8; and Wisconsin, 7.7); these states accounted for 14,959 (91%) of the nationally reported cases. In 1996, zero cases were reported from five states (Alaska, Arizona, Colorado, Montana, and South Dakota). Eighty-seven counties each reporting greater than or equal to 20 cases accounted for 89% of all reported cases. Reported incidences were greater than 100 per 100,000 ** in 18 counties in Connecticut, Maryland, Massachusetts, North Carolina, New Jersey, New York, Pennsylvania, Rhode Island, and Wisconsin; the highest reported county-specific incidence (1247.5 per 100,000) was in Nantucket County, Massachusetts (Figure_2). From 1995 to 1996, a total of 28 states reported increases in the number of cases, 16 states reported decreases, and seven states reported no change. Approximately 90% of the total increase in reported cases in 1996 occurred in five states (Connecticut, New Jersey, New York, Pennsylvania, and Rhode Island) where average annual LD incidence rates had exceeded the national average for the previous 5 years combined. Of 5298 cases for which information was available, 217 (4%) were reported as having been acquired outside of the United States, and 156 (3%) cases were reported as having been acquired in the United States but outside of the reporting state. The highest proportions of cases occurred among persons aged 0-14 years (3784 {23%}) and adults aged 40-79 years (7694 {47%}). Of 16,422 cases for which sex was reported, 8634 (53%) were male. Reported by: State health depts. Bacterial Zoonoses Br, Div of Vector-Borne Infectious Diseases, National Center for Infectious Disease, CDC. Editorial NoteEditorial Note: LD continues to be an important emerging infection: geographic spread within states with endemic disease and intensified transmission of the LD spirochete in established foci of infection have been associated with increased numbers of reported cases in the United States. In the eastern United States, the patterns of human LD cases reflect the geographic distribution of Ixodes scapularis, also known as the black-legged or deer tick (2,3). Substantial annual fluctuations since 1992 in the number of reported cases in several northeastern states with endemic disease have been attributed, in part, to variations in I. scapularis density (4,5). The principal vector in western coastal states is
Increases in reported LD cases in 1996 were limited to certain counties in some states, consistent with focal differences in the distribution and density of the tick vector. In both Connecticut and Rhode Island, the numbers of reported cases of LD increased statewide, although increases were greatest in coastal counties. In both states, this increase was associated with increased population densities of I. scapularis (K. Stafford, Connecticut Agricultural Experiment Station, and T. Mather, University of Rhode Island, personal communications, 1997). In New York, the greatest increases occurred in Dutchess County, where reported cases of LD nearly doubled from 1995 (918) to 1996 (1832). Because an LD vaccine trial was being conducted in the area, some of this increase may have resulted from heightened awareness and reporting of LD. The number of reported cases was stable in other counties of New York with endemic disease, including Putnam, Suffolk, and Westchester counties. In New Jersey, eight counties with active surveillance reported higher rates than the remaining counties with passive surveillance systems. Since 1991, state health departments in regions with endemic disease have been expanding their use of laboratory testing for assisting in LD surveillance. A positive laboratory result is required for reporting of persons with systemic manifestations of LD but is not required for persons with an erythema migrans rash greater than or equal to 5 cm in diameter (i.e., early LD). Since August 1995, when CDC published recommendations for standardized two-step (enzyme immunoassay and Western immunoblot) serodiagnostic testing for LD (7), states have reported a shift toward use of the recommended two-step method in diagnostic laboratories. The impact of these changes in laboratory methods on LD surveillance is unknown. The increase in reported LD cases in 1996 probably represents a combination of increased tick density, enhanced health-care provider awareness and reporting, and improved laboratory surveillance. In addition, case reporting has been enhanced through the availability of CDC resources for LD surveillance in eight states (Connecticut, Michigan, Minnesota, New Jersey, New York, Oregon, Rhode Island, and West Virginia). Most LD cases respond well to appropriate antibiotic therapy; drugs of choice include amoxicillin, doxycycline, and ceftriaxone (8). Vaccines to prevent LD are under evaluation but are not yet available. Personal protection methods recommended for preventing cases of LD and other tickborne diseases (e.g., babesiosis, ehrlichiosis, and Rocky Mountain spotted fever) include wearing light-colored clothing (to more readily detect ticks), tucking long pants into socks, using insect repellents and acaricides according to label directions, and performing tick checks at least daily. The use of environmental modifications to residential properties (e.g., application of insecticides, use of deer fencing, and removal of leaf litter) also may help prevent LD. References
* State rates are based on 1996 population estimates. ** County rates are based on 1990 population estimates. Figure_1  Return to top. Figure_2  Return to top. Table_1 Note: To print large tables and graphs users may have to change their printer settings to landscape and use a small font size. TABLE 1. Number of reported cases of Lyme disease, by state, 1991-1996 *, and rate + of Lyme disease, 1996 -- United States ========================================================================================================= State 1991 1992 1993 1994 1995 1996 Total 1996 Rate --------------------------------------------------------------------------------------------------------- Alabama 13 10 4 6 12 9 54 0.2 Alaska 0 0 0 0 0 0 0 0.0 Arizona 1 0 0 0 1 0 2 0.0 Arkansas 31 20 8 15 11 27 112 1.1 California 265 231 134 68 84 80 862 0.3 Colorado 1 0 0 1 0 0 2 0.0 Connecticut 1,192 1,760 1,350 2,030 1,548 3,104 10,984 94.8 Delaware 73 219 143 106 56 173 770 23.9 District of Columbia 5 3 2 9 3 3 25 0.6 Florida 35 24 30 28 17 55 189 0.4 Georgia 25 48 44 127 14 1 259 0.0 Hawaii 0 2 1 0 0 1 4 0.1 Idaho 2 2 2 3 0 2 11 0.2 Illinois 51 41 19 24 18 10 163 0.1 Indiana 16 22 32 19 19 32 140 0.5 Iowa 22 33 8 17 16 19 115 0.7 Kansas 22 18 54 17 23 36 170 1.4 Kentucky 44 28 16 24 16 26 154 0.7 Louisiana 6 7 3 4 9 9 38 0.2 Maine 15 16 18 33 45 61 188 4.9 Maryland 282 183 180 341 454 447 1,887 8.8 Massachusetts 265 223 148 247 189 321 1,393 5.3 Michigan 46 35 23 33 5 20 162 0.2 Minnesota 84 197 141 208 208 251 1,089 5.4 Mississippi 8 0 0 0 17 21 46 0.8 Missouri 207 150 108 102 53 52 672 1.0 Montana 0 0 0 0 0 0 0 0.0 Nebraska 25 22 6 3 6 5 67 0.3 Nevada 5 1 5 1 6 2 20 0.1 New Hampshire 38 44 15 30 28 47 202 4.0 New Jersey 915 688 786 1,533 1,703 2,190 7,815 27.4 New Mexico 3 2 2 5 1 1 14 0.1 New York 3,944 3,448 2,818 5,200 4,438 5,301 25,149 29.2 North Carolina 73 67 86 77 84 66 453 0.9 North Dakota 2 1 2 0 0 2 7 0.3 Ohio 112 32 30 45 30 32 281 0.3 Oklahoma 29 27 19 99 63 45 282 1.4 Oregon 5 13 8 6 20 19 71 0.6 Pennsylvania 718 1,173 1,085 1,438 1,562 2,814 8,790 23.3 Rhode Island 142 275 272 471 345 534 2,039 53.9 South Carolina 10 2 9 7 17 9 54 0.2 South Dakota 1 1 0 0 0 0 2 0.0 Tennessee 35 31 20 13 28 24 151 0.5 Texas 57 113 48 56 77 97 448 0.5 Utah 2 6 2 3 1 1 15 0.0 Vermont 7 9 12 16 9 26 79 4.4 Virginia 151 123 95 131 55 57 612 0.9 Washington 7 14 9 4 10 18 62 0.3 West Virginia 43 14 50 29 26 12 174 0.7 Wisconsin 424 525 401 409 369 396 2,524 7.7 Wyoming 11 5 9 5 4 3 37 0.6 Total 9,470 9,908 8,257 13,043 11,700 16,461 68,839 6.2 --------------------------------------------------------------------------------------------------------- * Data for 1996 are provisional. + Per 100,000 population. ========================================================================================================= Return to top. Disclaimer All MMWR HTML versions of articles are electronic conversions from ASCII text into HTML. This conversion may have resulted in character translation or format errors in the HTML version. Users should not rely on this HTML document, but are referred to the electronic PDF version and/or the original MMWR paper copy for the official text, figures, and tables. An original paper copy of this issue can be obtained from the Superintendent of Documents, U.S. Government Printing Office (GPO), Washington, DC 20402-9371; telephone: (202) 512-1800. Contact GPO for current prices. **Questions or messages regarding errors in formatting should be addressed to mmwrq@cdc.gov.Page converted: 09/19/98 |
|||||||||
This page last reviewed 5/2/01
|