 |
|
|
|
|
|
|
| ||||||||||
|
|
|
|
|
|
|
||||
| ||||||||||
|
|
|
|
|
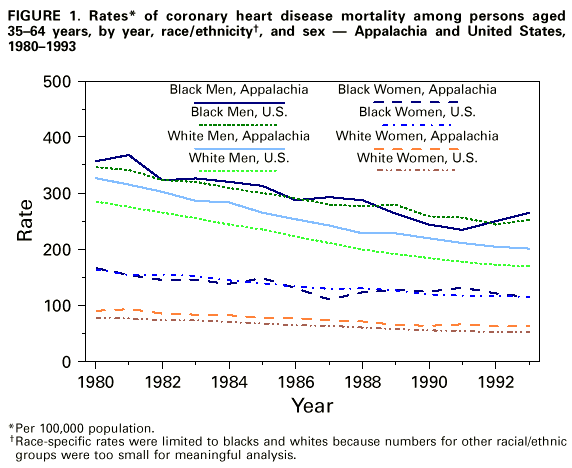
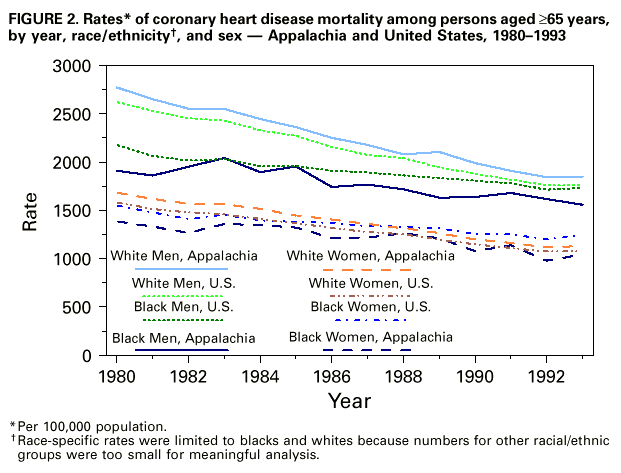
Persons using assistive technology might not be able to fully access information in this file. For assistance, please send e-mail to: mmwrq@cdc.gov. Type 508 Accommodation and the title of the report in the subject line of e-mail. Coronary Heart Disease Mortality Trends Among Whites and Blacks Appalachia and United States, 1980-1993Although heart disease-associated mortality has declined steadily since the 1960s, heart disease remains the leading cause of death for both men and women of all races/ethnicities in the United States (1). This report compares temporal trends in coronary heart disease (CHD) death rates for blacks and whites from 1980 to 1993 (the latest year for which data were available) in the Appalachian Region * with trends for the entire United States. The findings indicate that among whites aged greater than or equal to 35 years the burden of CHD is greater in Appalachia than in the entire United States, with the disparity increasing over time, and among blacks, only slight differences in CHD rates between Appalachia and the United States were observed. From 1980 through 1993, annual age-adjusted CHD death rates for persons aged greater than or equal to 35 years were calculated using mortality data compiled by CDC and population estimates from the Bureau of the Census. For both Appalachia and the United States, CHD death rates were calculated separately for blacks and whites by sex and age group (i.e., ages 35-64 and greater than or equal to 65 years). The 1980 U.S. population aged greater than or equal to 35 years was the standard for age adjustment. CHD deaths were defined as deaths for which the underlying cause was listed on the death certificate as codes 410.0-414.0 and 429.2 of the International Classification of Diseases, Ninth Revision (ICD-9). The cause of death is reported by attending physicians, medical examiners, and coroners on death certificates and is subsequently coded according to the ICD-9. Linear regression models, with year as the independent variable and log-transformed annual CHD death rate as the dependent variable, were estimated separately for each group. Beta coefficients from each model were used to calculate the average annual percentage change in CHD mortality. CHD mortality declined from 1980 through 1993 for each of the demographic groups for both Appalachia and the United States; however, Appalachia and the United States differed in both the level of CHD mortality and the magnitude of decline for most demographic groups. Among persons aged 35-64 years, CHD death rates for whites in Appalachia were consistently higher than those for the entire United States (Figure_1). CHD death rates were 15% higher among white men aged 35-64 years in Appalachia than among white men in the United States in 1980; in 1993, rates were 19% higher for white men in Appalachia. Similarly, CHD death rates were 15% higher among white women aged 35-64 years in Appalachia than among white women in the United States in 1980; in 1993, rates were 21% higher for white women in Appalachia. In comparison, CHD death rates for blacks aged 35-64 years only differed slightly between Appalachia and the entire United States (Figure_1). For Appalachian residents aged 35-64 years, the average annual declines in CHD mortality from 1980 through 1993 were 2.3% for black women, 3.1% for black men, 3.3% for white women, and 3.9% for white men. In the United States, average annual declines in the same age group were 2.7% for black men, 2.8% for black women, 3.4% for white women, and 4.3% for white men. Among persons aged greater than or equal to 65 years, whites in Appalachia had slightly higher CHD death rates than whites in the same age group in the entire United States (6% higher in 1980 and 5% higher in 1993) (Figure_2). In comparison, blacks aged greater than or equal to 65 years experienced slightly lower CHD death rates in Appalachia than blacks in the same age group in the entire United States (Figure_2). From 1980 through 1993, average annual declines in CHD mortality for Appalachian residents aged greater than or equal to 65 years were 1.8% for black men, 2.3% for black women, 3.2% for white men, and 3.3% for white women. In the United States, average annual declines for persons in the same age group were 1.6% for black men, 1.7% for black women, 3.1% for white women, and 3.3% for white men. Reported by: E Barnett, PhD, VE Braham, MA, JA Halverson, MA, Dept of Community Medicine; GA Elmes, PhD, Dept of Geology and Geography, West Virginia Univ, Morgantown, West Virginia. Cardiovascular Health Br, Div of Adult and Community Health, National Center for Chronic Disease Prevention and Health Promotion, CDC. Editorial NoteEditorial Note: The findings of this report corroborate recent reports showing important geographic and race/ethnicity variability in both levels and rates of decline in CHD mortality (3-7). The burden of CHD mortality observed among whites in Appalachia increased during 1980-1993. In both Appalachia and the entire United States, CHD death rates for blacks remained higher than rates for whites; however, among blacks there were only slight differences in CHD death rates between Appalachia and the entire United States. The findings in this report are subject to at least two limitations. First, data used to calculate CHD death rates in this study include census undercounts of black populations and variations in the accuracy of reporting underlying cause of death on death certificates. Second, examination of CHD death rates for a large region such as Appalachia obscures important geographic variation in risk for heart disease within the region. Rural and less affluent counties within Appalachia were at highest risk for CHD mortality and were least likely to have adequate economic and medical-care resources (8). The findings in this report suggest that the social and environmental conditions and resources that influence CHD mortality for whites aged greater than or equal to 35 years may differ between Appalachia and the United States. The Appalachian region is characterized by low levels of urbanization and lower standards of living than the nation (9). Life expectancy for both men and women is lower in Appalachian counties than the United States (10). In addition to low levels of economic resources, many Appalachian counties lack medical-care facilities (e.g., hospital coronary-care units and cardiac-rehabilitation units) for treatment of CHD (8). The population of Appalachia is predominantly white; however, blacks comprise 6% of the population, with several rural counties of southern Appalachia having black populations that are more than 20%. The similarity of CHD death rates for blacks in Appalachia with those in the nation overall suggests the need to examine the similarities in socioenvironmental conditions and resources for blacks in Appalachia compared with the United States. Increasing inequalities in CHD mortality trends for whites between Appalachia and the nation from 1980 through 1993 indicate the need for public health interventions focused on this disadvantaged region. In Appalachia, policies and programs should be instituted that enhance both primary and secondary prevention of heart disease mortality. Secondary prevention of heart disease requires improved access to medical-care facilities and health-care professionals, especially for residents of isolated rural counties. In addition, persons with heart disease require social support from their families and communities, and access to facilities and programs for cardiac rehabilitation. Primary prevention of heart disease mortality requires communitywide improvements in the social environment, including full employment in healthy work environments, access to affordable healthy foods and recreational facilities, and opportunities for social interaction and participation in civic life. References
Appalachia is comprised of 399 counties, including all of West Virginia and parts of Alabama, Georgia, Kentucky, Maryland, Mississippi, New York, North Carolina, Ohio, Pennsylvania, South Carolina, Tennessee, and Virginia (2). Figure_1  Return to top. Figure_2  Return to top. Disclaimer All MMWR HTML versions of articles are electronic conversions from ASCII text into HTML. This conversion may have resulted in character translation or format errors in the HTML version. Users should not rely on this HTML document, but are referred to the electronic PDF version and/or the original MMWR paper copy for the official text, figures, and tables. An original paper copy of this issue can be obtained from the Superintendent of Documents, U.S. Government Printing Office (GPO), Washington, DC 20402-9371; telephone: (202) 512-1800. Contact GPO for current prices. **Questions or messages regarding errors in formatting should be addressed to mmwrq@cdc.gov.Page converted: 11/25/98 |
|||||||||
This page last reviewed 5/2/01
|