 |
|
|
|
|
|
|
| ||||||||||
|
|
|
|
|
|
|
||||
| ||||||||||
|
|
|
|
|
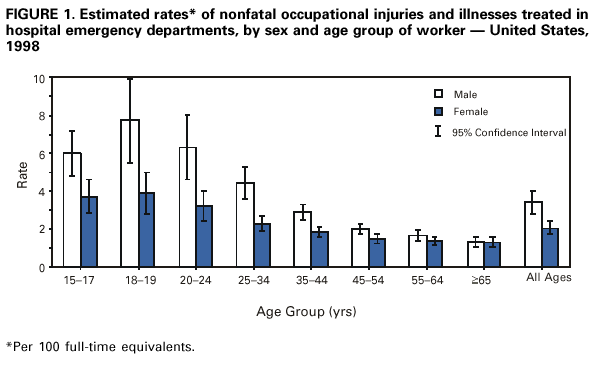
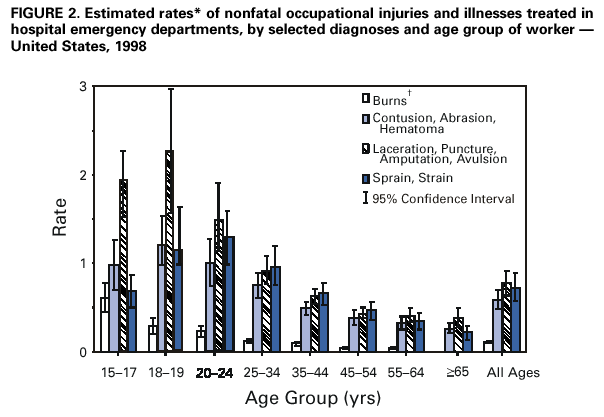
Persons using assistive technology might not be able to fully access information in this file. For assistance, please send e-mail to: mmwrq@cdc.gov. Type 508 Accommodation and the title of the report in the subject line of e-mail. Nonfatal Occupational Injuries and Illnesses Treated in Hospital Emergency Departments --- United States, 1998The National Electronic Injury Surveillance System (NEISS) includes data about nonfatal occupational injuries and illnesses treated in U.S. hospital emergency departments (EDs). This report summarizes 1998 injury and illness estimates based on NEISS, which indicate that the magnitude and patterns of nonfatal occupational injuries and illnesses were comparable to estimates reported for 1996 (1). Younger workers continue to have the highest rates of work-related injuries and illnesses; therefore, interventions should address the health and safety needs of young workers, most of whom lack substantial experience in the work place. In 1998, NEISS identified approximately 47,000 work-related injuries and illnesses treated in 67 EDs derived from a national stratified probability sample of all U.S. hospitals with a minimum of six beds and a 24-hour ED.* The NEISS sampling frame for work-related ED visits was updated in October 1997 based on the 1995 listing of U.S. hospitals with EDs. As a result, compared with earlier reports, the updated hospital sample had changes in the makeup of hospitals within each size stratum in the sample and the statistical weights for cases, which are used to extrapolate to national estimates (1). Work-related ED visits for injury or illness were identified from admissions information and ED chart review. A work-related case was defined as any injury or illness incurred by a civilian worker while working for compensation, arriving or leaving work but on the employers' premises, during transportation between locations as a part of the job (excluding commuting to or from home), doing agricultural production activities, or working as a volunteer for an organized group (e.g., volunteer fire department) (2). Military injuries, common illness cases (e.g., colds or viruses), routine drug and alcohol screening, and revisits to an ED for a previously treated injury or illness were excluded. Employment estimates, used to calculate injury rates, were 12-month averages for 1998 Current Population Survey (CPS) data based on full-time equivalent (FTE) workers (1 FTE=2000 hours per year) (3). CPS is a monthly household survey of the U.S. civilian, noninstitutionalized population aged >15 years that includes wage and salary workers, self-employed workers, part-time workers, and unpaid workers who worked >15 hours a week in family-operated enterprises, but excludes volunteers for organized groups. However, cases involving volunteer workers were not removed from the injury/illness estimates or rate estimates presented in this report because of difficulties in identifying these workers in the NEISS database. Injuries and illnesses to workers aged <14 years (0.1% of total) were included in the total injury/illness estimates but were excluded from injury/illness estimates in the rate calculations because employment data for this age group were not available. In 1998, an estimated 3,600,000 (95% confidence interval [CI]=±600,000) occupational injuries and illnesses to workers of all ages were treated in EDs. The overall occupational injury and illness rate was 2.9 (95% CI=±0.5) per 100 FTE workers aged >15 years. The injury and illness rate for males (3.4; 95% CI=±0.6) was 1.6 times the rate for females (2.1; 95% CI=±0.3). The rate was highest for younger workers and decreased with increasing age (Figure 1). Workers aged 15--17 years had a particularly high rate of burns, ranging from two- to 10-fold higher than that for older workers (Figure 2). Burns and lacerations accounted for one half of injuries to workers aged <20 years and approximately one fourth to one third of injuries to workers aged >20 years. In 1998, approximately 70% of injuries resulted in lacerations, punctures, amputations, and avulsions (27%); sprains and strains (25%); and contusions, abrasions, and hematomas (21%). Hands and fingers, the most commonly injured body parts (30%), were treated almost twice as frequently in EDs as injuries to other anatomic groups: trunk, back, and groin (18%); head and neck (17%); lower extremities (17%); and upper extremities (excluding hands and fingers) (15%). Nearly all of the estimated 3.6 million work-related injuries and illnesses were treated in EDs and released. Approximately 60,000 (95% CI=±16,000) of these injuries/illnesses resulted in hospitalization, and an additional 18,000 (95% CI=±5,000) were transferred from the ED to another medical facility. Of hospitalized patients, 85% were males. The highest proportion of hospitalizations (35%) were the result of fractures and dislocations. Reported by: Div of Safety Research, National Institute for Occupational Safety and Health, CDC. Editorial Note:The findings in this report indicate that the number and distribution of work-related injuries/illnesses treated in an ED and the injury/illness rates, overall and by sex, were approximately equal for 1996 and 1998. These trends continue to be consistent with general patterns observed in the earliest NEISS-based national estimates of ED-treated nonfatal work-related injuries/illnesses reported for 1982 (4). The 1996 NEISS injury estimates were based on a hospital sampling frame that used the 1985 listing of U.S. hospitals. Because of the 1997 sampling frame update and changes in procedures for correcting hospital underreporting, the previously reported estimate for 1996 of 3.3 million injuries (1) is now crudely estimated to be approximately 4% lower (3.2 million) (NIOSH and the Consumer Product Safety Commission, unpublished data, 2000). Proportional distributions for 1996 are influenced minimally by the sampling and weighting factors and are more directly comparable to 1998 estimates. The Bureau of Labor Statistics (BLS) reported approximately 5.9 million nonfatal occupational injuries and illnesses in 1998, with an incidence rate of 6.7 injuries/illnesses per 100 FTE workers for private industry (5). BLS excludes the self-employed, small farms, and government employees, restrictions that do not apply to the NEISS work-related injury estimates. However, NEISS estimates are restricted to ED-treated injuries and illnesses; BLS includes workplace injuries and illnesses treated in any health-care venue. If 1998 patterns of medical treatment are similar to those determined from the 1988 National Health Interview Survey (NHIS) Occupational Supplement (1), then the 3.6 million ED-treated injuries/illnesses in NEISS represent approximately one third (34%; 95% CI=±5%) of all U.S. work-related injuries/illnesses that required medical treatment or resulted in lost work time of more than 1 day in 1998. By crude extrapolation, approximately 10 million occupational injuries and illnesses in 1998 is probably a more comprehensive figure for the overall injury/illness burden of U.S. workers. Workers aged 15--17 years had an injury/illness rate of 4.9 per 100 FTE in 1998. Most of these injuries in younger workers were probably related to the high proportion of youth working in services and retail trades, particularly eating establishments (6,7). Teenagers are at particularly high risk for injuries because they frequently lack substantial work experience, safety training, and appreciation for their workplace injury risk. One of the national health objectives for 2010 is to reduce the adolescent occupational injury rate to no more than 3.4 per 100 FTE workers aged 16--17 years (objective 20-2h) (8). Effective strategies to address workplace safety issues for youth, such as those developed in community-based young worker projects in California and Massachusetts (9), must be implemented to meet the objective. References
* Through a collaboration between NIOSH and the U.S. Consumer Product Safety Commission (CPSC), work-related injury and illness information was collected without limitations by age, consumer product involvement, or type of injury event at two thirds of the 101 NEISS hospitals used by CPSC for the collection of product-related injuries. Percentage of the 3.1 million occupational injuries estimated for 1988 that received initial medical treatment in an ED. The 2000 NHIS is expected to provide a more up-to-date estimate of ED use for occupational injuries and may indicate that use of different medical venues has changed substantially since the 1988 survey. Figure 1  Return to top. Figure 2  Return to top. Disclaimer All MMWR HTML versions of articles are electronic conversions from ASCII text into HTML. This conversion may have resulted in character translation or format errors in the HTML version. Users should not rely on this HTML document, but are referred to the electronic PDF version and/or the original MMWR paper copy for the official text, figures, and tables. An original paper copy of this issue can be obtained from the Superintendent of Documents, U.S. Government Printing Office (GPO), Washington, DC 20402-9371; telephone: (202) 512-1800. Contact GPO for current prices. **Questions or messages regarding errors in formatting should be addressed to mmwrq@cdc.gov.Page converted: 4/26/2001 |
|||||||||
This page last reviewed 5/1/2001
|