 |
|
|
|
|
|
|
| ||||||||||
|
|
|
|
|
|
|
||||
| ||||||||||
|
|
|
|
|
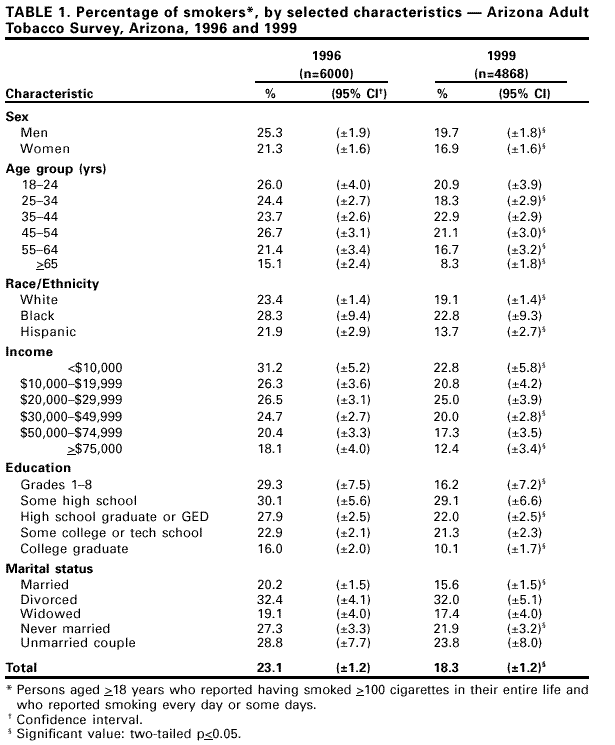
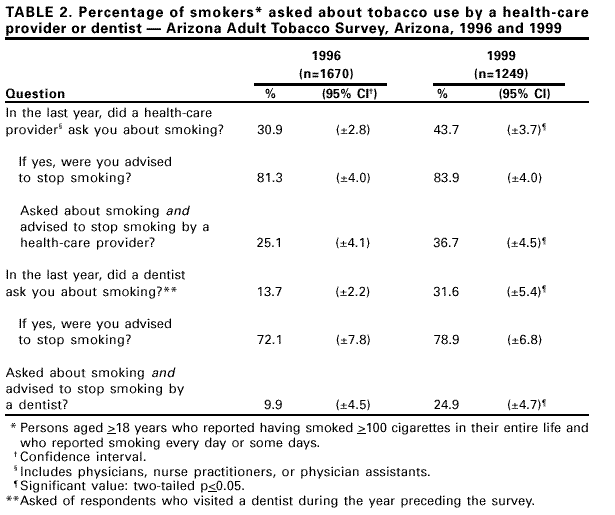
Persons using assistive technology might not be able to fully access information in this file. For assistance, please send e-mail to: mmwrq@cdc.gov. Type 508 Accommodation and the title of the report in the subject line of e-mail. Tobacco Use Among Adults --- Arizona, 1996 and 1999In 1994, Arizona passed the Tobacco Tax and Healthcare Act (Proposition 200) that increased the tax on cigarettes from $0.18 to $0.58, and allocated 23% of the resulting revenues to tobacco-control activities. Since 1995, Arizona has used the tobacco-control funds (approximately $30 million per year) to support the Arizona Department of Health Services (ADHS) Tobacco Education and Prevention Program (TEPP), a comprehensive program to prevent and reduce tobacco use. To track changes in tobacco use, the knowledge and opinions of Arizona residents about tobacco use, and the proportion of smokers advised to quit smoking by health-care providers, ADHS conducted the Arizona Adult Tobacco Survey (ATS) in 1996 and a follow-up survey in 1999. This report compares results of these two surveys, which indicate that prevalence of tobacco use among adults decreased, and the proportion of adults who were both asked about tobacco use and advised to quit by health-care providers and dentists increased. On the basis of these findings, if all states implemented comprehensive programs similar to those in Arizona, the national health objective for 2010 of reducing the adult smoking rate by half during this decade could be achieved. The Arizona ATS is a random-digit--dialed, computerized, telephone-interview survey of Arizona residents aged >18 years in five regions of the state. Surveys were conducted in English or Spanish. In 1996, 6000 surveys were completed, and in 1999, 4868 were completed. The response rate (1) was 83.4% for the 1996 survey and 74.6% for the 1999 survey. To ensure representativeness and comparability, the samples in 1996 and 1999 were standardized to the 1996 age/race distribution for Arizona. The data were weighted by the number of adults in the household and the proportion of the adult population in the regions sampled. The surveys were analyzed by using SAS for point estimates and SUDAAN for standard errors. Hypothesis tests for changes in point estimates of current smoking were conducted for each demographic category. Resulting two-tailed p-values of <0.05 were significant. A current smoker was defined as someone who answered "yes" to the question "Have you smoked at least 100 cigarettes in your entire life?" and who answered "every day" or "some days" to the question "Do you now smoke cigarettes every day, some days, or not at all?" Current smokers also were asked whether their health-care provider asked them about smoking and, if so, whether their health-care provider advised them to quit. Prevalence of current smoking declined among women, men, whites, and Hispanics (Table 1). The greatest decrease in smoking prevalence, by age, was among smokers aged >65 years. By income level, the most substantial decline in smoking prevalence was among those with a household income of <$10,000 per year. By education level, the greatest reduction in smoking was among persons with an 8th grade education or less. From 1996 to 1999, a significant increase was found in the percentage of smokers who were asked about smoking by health-care providers (i.e., physicians, nurse practitioners, physician assistants) and dentists (Table 2). Although no difference was found between 1996 and 1999 in the proportion of smokers advised to quit smoking (of those who were asked about smoking), the overall proportion of smokers both asked about smoking and advised to quit by a health-care provider (the product of the first two proportions) increased from 25.1% (95% confidence interval [CI]=±4.1) in 1996 to 36.7% (95% CI=±4.5) in 1999. The proportion of smokers who were both asked about smoking and advised to quit by a dentist increased from 9.9% (95% CI=±4.5) in 1996 to 24.9% (95% CI=±4.7) in 1999. Reported by: RS Porter, MS, VR Gowda, MHS, K Kotchou, MPH, J Nodora, DrPH, R Leischow, MPH, Arizona Dept of Health Svcs. Office on Smoking and Health, National Center for Chronic Disease Prevention and Health Promotion, CDC. Editorial Note:The results of the 1996 and 1999 Arizona ATS indicate that the prevalence of cigarette use among Arizona adults decreased substantially following the implementation of the statewide Arizona TEPP. The decrease in smoking prevalence among low income and low education groups also indicates a narrowing in disparities in cigarette use. TEPP directed many of its activities toward Hispanics, which may, in part, explain the substantial decrease in cigarette smoking in that population. TEPP serves the Hispanic population through its Spanish language statewide media campaign and telephone helpline and through local cessation and prevention services. TEPP uses methods appropriate for this population, including Promotoras de Salud (lay health workers) and culturally appropriate materials and curricula. The Arizona ATS results also showed a substantial increase in the proportion of smokers who reported that either a health-care provider or a dentist both asked about tobacco use and advised them to quit. Health-care providers can play a key role in assisting patients to quit smoking (2), and brief physician advice substantially increases successful quitting (2). TEPP, through statewide and local projects, provides training for health-care providers to increase the number of patients with whom they briefly discuss stopping smoking. The findings in this report are subject to at least five limitations. First, it is difficult to separate the effects of TEPP from price increases. The cigarette tax in Arizona increased from $0.18 to $0.58 per pack in November 1994, which may have contributed to the decline in adult smoking prevalence. Although the tax increase occurred more than a year before the first survey, the average retail price of cigarettes in Arizona continued to increase from $2.08 in 1996 to $2.50 in 1999 (3). Second, some segments of the population in Arizona, including some low income residents, are more likely than others to lack telephone service and therefore not be included in the study sample. Third, the response rate in 1999 was almost nine percentage points lower than the response rate in 1996, which may have influenced the results. Fourth, health-care provider communication data about smoking was based on self-reported recall for an entire year; the validity of these self-reports was not determined. Finally, although declines in smoking rates in Arizona may be a result of TEPP, a cause-and-effect relation cannot be established by comparing data from the cross-sectional ATS surveys alone. Comparing Arizona smoking prevalence trends and trends in other states with varying levels of interventions during 1996--1999 could help to determine how much of the decline may be related to the Arizona TEPP rather than to regional or national influences. Arizona is one of seven states that meet CDC's funding recommendations for FY 2001 (4,5). The Arizona TEPP incorporates all nine components of a comprehensive tobacco-control program as recommended by CDC (4). The program added a certification program for smoking cessation counselors. The Arizona TEPP has been implementing strategies recommended in the Surgeon General's report Reducing Tobacco Use (6), CDC's Best Practices for Comprehensive Tobacco Control Programs (4), the Clinical Practice Guidelines for Treating Tobacco Use and Dependence (2), and the Task Force on Community Preventive Services (7). The findings of the 1996 and 1999 Arizona ATS suggest that an adequately funded and comprehensive program can substantially reduce tobacco use overall and across diverse demographic groups. Recent reports from California indicate that sustaining such a program for at least 9 years also could result in reductions in lung and bronchial cancer and coronary heart disease rates (8,9). Attainment of the 2010 national health objective (10) to reduce adult smoking rates to <12% will require similar programs to be implemented across the United States. References
Table 1  Return to top. Table 2  Return to top. Disclaimer All MMWR HTML versions of articles are electronic conversions from ASCII text into HTML. This conversion may have resulted in character translation or format errors in the HTML version. Users should not rely on this HTML document, but are referred to the electronic PDF version and/or the original MMWR paper copy for the official text, figures, and tables. An original paper copy of this issue can be obtained from the Superintendent of Documents, U.S. Government Printing Office (GPO), Washington, DC 20402-9371; telephone: (202) 512-1800. Contact GPO for current prices. **Questions or messages regarding errors in formatting should be addressed to mmwrq@cdc.gov.Page converted: 6/8/2001 |
|||||||||
This page last reviewed 6/8/2001
|