 |
|
|
|
|
|
|
| ||||||||||
|
|
|
|
|
|
|
||||
| ||||||||||
|
|
|
|
|
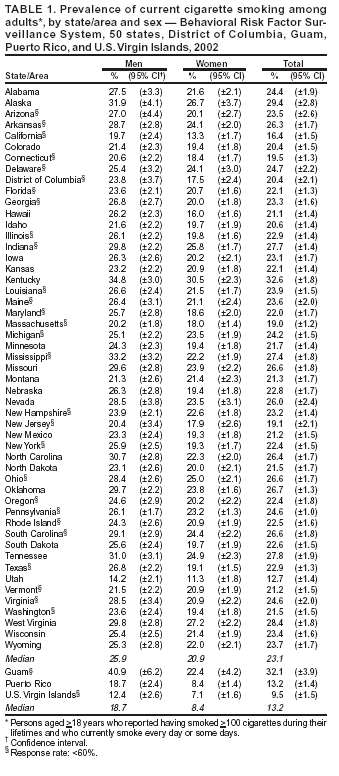
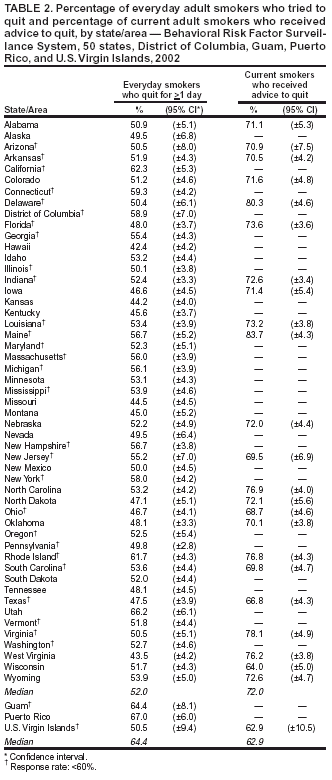
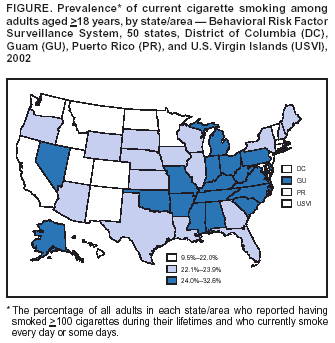
Persons using assistive technology might not be able to fully access information in this file. For assistance, please send e-mail to: mmwrq@cdc.gov. Type 508 Accommodation and the title of the report in the subject line of e-mail. State-Specific Prevalence of Current Cigarette Smoking Among Adults ---United States, 2002Cigarette smoking in the United States causes serious illnesses among an estimated 8.6 million persons (1) and approximately 440,000 deaths annually (2), resulting in $157 billion in health-related economic costs (2). To reduce smoking prevalence, morbidity, mortality, and economic impact, state tobacco-control programs should include interventions to help persons stop smoking (3). To assess the prevalence of current cigarette smoking among adults, attempts to quit, and receipt of physician advice to quit during the preceding year, CDC analyzed data from the 2002 Behavioral Risk Factor Surveillance System (BRFSS) survey. This report summarizes the results of that analysis, which indicated a threefold difference in smoking prevalence across the 50 states, the District of Columbia (DC), Guam, Puerto Rico, and the U.S. Virgin Islands (range: 9.5%--32.6%) (Figure). To support smokers' attempts to quit, states/areas should implement comprehensive tobacco-control programs that include interventions to help persons stop smoking (e.g., quitlines). BRFSS is a state-based, random-digit--dialed telephone survey of the noninstitutionalized, civilian U.S. population aged >18 years. Because BRFSS data are state-specific, median prevalences were reported rather than national averages. Estimates were weighted by age, race/ethnicity, and sex distribution of each state's population, and 95% confidence intervals were calculated by using SUDAAN. The median response rate across states/areas was 58.3% (range: 42.2%--82.6%). Current cigarette smoking status was determined by asking respondents, "Have you smoked at least 100 cigarettes in your entire life?" and "Do you now smoke cigarettes every day, some days, or not at all?" Current smokers were defined as those who reported having smoked >100 cigarettes during their lifetimes and who currently smoke every day or some days. Attempted smoking cessation was assessed by asking every day smokers, "During the past 12 months, have you stopped smoking for 1 day or longer because you were trying to quit?" Respondents in 23 states and the U.S. Virgin Islands also were asked about receipt of physician advice to quit. Current smokers who had visited a health-care professional were asked, "In the past 12 months, has a doctor, nurse, or other health professional advised you to quit smoking?" Cigarette Smoking PrevalenceDuring 2002, the median prevalence of current smoking in the 50 states and DC was 23.1% (range: 12.7% [Utah]--32.6% [Kentucky]) (Table 1). Current smoking prevalence also was highest in Alaska (29.4%), West Virginia (28.4%), Tennessee (27.8%), and Indiana (27.7%). Smoking prevalence was lowest in Utah (12.7%), California (16.4%), Massachusetts (19.0%), New Jersey (19.1%), and Connecticut (19.5%). In other areas, current smoking prevalence was 32.1% in Guam, 13.2% in Puerto Rico, and 9.5% in the U.S. Virgin Islands. The median smoking prevalence in the 50 states and DC was higher for men (25.9% [range: 14.2%--34.8%]) than for women (20.9% [range: 11.3%--30.5%]). Kentucky had the highest prevalence for both men (34.8%) and women (30.5%), and Utah had the lowest prevalence for both men (14.2%) and women (11.3%). Attempts to Quit SmokingAmong the 50 states and DC, the median proportion of everyday smokers who tried to quit smoking during the preceding year was 52.0% (range: 42.4% [Hawaii]--66.2% [Utah]) (Table 2). Among respondents in the 23 states who were asked about receipt of physician advice to quit, the median proportion of current smokers who had received advice to quit during the preceding year was 72.0% (range: 64.0% [Wisconsin]--83.7% [Maine]) (Table 2). Overall, the median proportion of current smokers who had received advice to quit during the preceding year did not vary substantially by age, race/ethnicity, or sex. Reported by: J Bombard, MSPH, A Trosclair, MS, M Schooley, MPH, C Husten, MD, Office of Smoking and Health, National Center for Chronic Disease Prevention and Health Promotion, CDC. Editorial Note:One of the national health objectives for 2010 is to reduce the prevalence of current smoking among adults to <12% (objective 27-1) (4). The findings in this report indicate that this objective has been achieved only in the U.S. Virgin Islands. The median proportion of everyday smokers who stopped smoking for >1 day was 52.0%, compared with 45.0% in 1996 (CDC, unpublished data, 1996). This increase in quit attempts might reflect decreased acceptability of smoking, an increase in clean-indoor--air laws and policies, and higher taxes implemented by certain states. In addition, the proportion of current smokers who had been advised to quit was 72.0%, which was higher than estimates from other surveys (5), although comparisons are limited by the number of states that asked the question. This increase might reflect efforts within health-care systems to increase treatment for tobacco users through proven interventions and system-level changes (e.g., physician reminders to provide counseling). The increases also might be attributed to expanded tobacco-control programs at the state level, including the expansion of evidence-based, telephone quitline services (6). During 1992--2002, states offering some form of quitline services increased from one to 32. Physicians often lack the time and often are not comfortable providing cessation counseling. Establishing readily accessible, free counseling services (e.g., quitlines) increases the availability of more intensive cessation assistance and might also encourage health-care providers to assess tobacco use and provide both advice to quit and medication (7). The findings in this report are subject to at least three limitations. First, BRFSS does not sample persons in households without telephones. Second, response rates might have affected estimates; however, BRFSS estimates are comparable with current smoking estimates obtained from other surveys with higher response rates (8). Finally, data were based on self-reports, and smoking status in BRFSS is not validated by biochemical markers. However, BRFSS data on cigarette smoking measures have moderate-to-high validity and high reliability (9), and self-reports of smoking have been found to be valid in other population-based surveys (10). To help states plan and implement comprehensive tobacco-cessation programs, CDC recommends several strategies, including implementing telephone quitlines, integrating tobacco cessation into routine health-care delivery, and making tobacco-treatment services a standard health benefit (3). Approximately 70% of smokers visit physicians each year (5), giving health-care providers the opportunity to reach smokers. Through these interactions, providers can advise smokers to quit, discuss appropriate treatments (e.g., medications and counseling), and provide referrals to quitlines or other community programs. To implement tobacco-control programs fully and reduce smoking prevalence further, CDC recommends spending $7--$20 per capita in smaller states (i.e., population of <3 million), $6--$17 per capita in medium-sized states (i.e., population of 3--7 million), and $5--$16 per capita in larger states (i.e., population of >7 million) (3). In 2002, per capita funding varied across states (range: $0.33--$19.16); few met CDC's minimum funding recommendations (4). In recent years, states have received less funding for tobacco-control programs, which inhibits expansion of cessation activities such as quitlines and implementation of recommended changes within the health-care system. Unless states expand cessation and other tobacco-control efforts, the 2010 national health objective of reducing smoking prevalence to <12% will not be achieved. References
Table 1  Return to top. Table 2  Return to top. Figure  Return to top.
Disclaimer All MMWR HTML versions of articles are electronic conversions from ASCII text into HTML. This conversion may have resulted in character translation or format errors in the HTML version. Users should not rely on this HTML document, but are referred to the electronic PDF version and/or the original MMWR paper copy for the official text, figures, and tables. An original paper copy of this issue can be obtained from the Superintendent of Documents, U.S. Government Printing Office (GPO), Washington, DC 20402-9371; telephone: (202) 512-1800. Contact GPO for current prices. **Questions or messages regarding errors in formatting should be addressed to mmwrq@cdc.gov.Page converted: 1/8/2004 |
|||||||||
This page last reviewed 1/8/2004
|