 |
|
|
|
|
|
|
| ||||||||||
|
|
|
|
|
|
|
||||
| ||||||||||
|
|
|
|
|
Persons using assistive technology might not be able to fully access information in this file. For assistance, please send e-mail to: mmwrq@cdc.gov. Type 508 Accommodation and the title of the report in the subject line of e-mail. Blood Lead Levels in Residents of Homes with Elevated Lead in Tap Water --- District of Columbia, 2004The methods and findings in this April 2004 MMWR report have been the subject of continuing interest. In two Notices to Readers, published in the May 21, 2010, and June 25, 2010, issues, CDC has noted limitations of methods employed and the manner in which findings were communicated. Readers should be aware of these limitations, as well as the steps taken to address them.
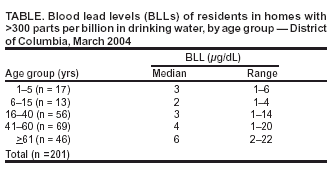
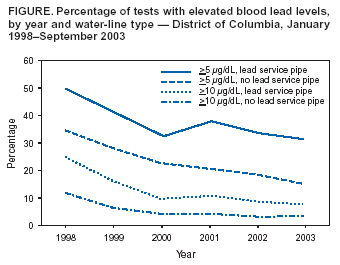
CDC authors have published an extended analysis. See: Brown MJ, Raymond J, Homa D, Kennedy C, Sinks T. Association between children’s blood lead levels, lead service lines, and water disinfection. Washington DC, 1998–2006. Environ Res 2010. Epub ahead of print. Available at http://www.elsevier.com/wps/find/journaldescription.cws_home/622821/description. On March 30, this report was posted as an MMWR Dispatch on the MMWR website (http://www.cdc.gov/mmwr). Lead exposure adversely affects intellectual development in young children and might increase the risk for hypertension in adults (1). In the District of Columbia (DC), of an estimated 130,000 residences, approximately 23,000 (18%) have lead service pipes (Daniel Lucey, MD, DC Department of Health [DCDOH], personal communication, March 24, 2004). The Environmental Protection Agency (EPA) requires water authorities to test tap water in 10--100 residences annually for lead. In March 2003, DC Water and Sewer Authority (WASA) expanded its lead-in-water testing program to homes with lead service pipes extending from the water main to the house. By late January 2004, results of the expanded water testing indicated that the majority of homes tested had water lead levels above EPA's action level of 15 parts per billion (ppb). On February 16, DCDOH requested CDC assistance to assess health effects of elevated lead levels in residential tap water. DCDOH also requested deployment of officers of the United States Public Health Service (USPHS) to assist in the investigations. This report summarizes the results of the preliminary investigations, which indicated that the elevated water lead levels might have contributed to a small increase in blood lead levels (BLLs). The investigation of elevated water lead levels is ongoing. In the interim, DCDOH has recommended that young children and pregnant and breast-feeding women refrain from drinking unfiltered tap water (2). CDC's BLL of concern for children, 10 µg/dL, was adopted in 1991 in response to evidence associating BLLs >10 µg/dL with adverse health effects (3). Adverse health effects have been reported recently at BLLs <10 µg/dL, particularly in vulnerable populations (e.g., infants and children) (4,5); no safe BLL has been identified (6). Longitudinal analysis was conducted to identify trends in BLLs in DC before and after changes in the water disinfection process by comparing homes with lead service pipes to homes without lead service pipes. Both the percentage of BLLs >10 µg/dL and those >5 µg/dL were examined over time. Cross-sectional analysis of BLLs of residents in homes with the highest water lead levels was conducted to determine if residents had BLLs >10 µg/dL. Longitudinal Analysis of Childhood Blood Lead Screening TestsWASA provided DCDOH and CDC with a list of homes (n = 26,141) with lead service pipes. During January 1998--December 2003, the DCDOH blood lead surveillance system recorded 84,929 BLLs. Of these, 43,314 (51%) tests were venous, and 6,794 (8%) were fingerstick; sample type was not listed on the remaining tests. All blood tests were used in this analysis. For each year of testing, these databases were linked by address. A total of 11,061 BLL laboratory requisition slips listed an address with a lead service pipe. During 1998--2000, the percentage of BLLs >10 µg/dL and >5 µg/dL decreased substantially, regardless of the type of service pipe (Figure). During 2000--2003, the percentage of BLLs >10 µg/dL in persons living in homes known to have lead service pipes decreased from 9.8% to 7.6% (p = 0.008). The percentage of BLLs >5 µg/dL in persons living in houses without lead service pipes continued to decrease, from 22.7% to 15.6% (n = 14,152; p<0.001). However, the percentage of BLLs >5 µg/dL in persons living in homes with lead service pipes did not decrease statistically significantly (from 696 [32.4%] to 405 [31.2%]; p = 0.34). Cross-Sectional Study of Homes with >300 ppb Lead in WaterWASA provided the results of lead testing on water samples from 6,170 homes. Of these, 163 (3%) had lead levels >300 ppb in second-draw water collected after a change in water temperature, indicating that some of the lead in the water leached from water pipes outside the home. USPHS officers working in the DCDOH Incident Command structure contacted residents in the 140 (86%) homes that had telephones and arranged for visits to draw venous samples for BLLs. The DC Public Health Laboratory determined BLLs by using graphite furnace atomic absorption spectrophotometry for 184 persons in 86 households who consented to having blood drawn. Residents were provided with a water filter and information about reducing lead exposure. In addition, in 12 of the households contacted, 17 persons had a venous blood test drawn independently and reported to DCDOH since January 2004. These test results also were included in this analysis. Of the 201 residents from 98 homes with water lead levels >300 ppb tested for BLLs, all had BLLs below CDC's levels of concern (10 µg/dL for children aged 6 months--15 years and 25 µg/dL for adults) (Table). Of the 201 residents, a total of 153 (76%) reported drinking tap water, and 52 households (53%) reported using a water filter. On February 26, 2004, DCDOH sent a letter to all DC homes with lead service pipes, recommending that young children and pregnant and breast-feeding women refrain from drinking unfiltered tap water (2). Reported by: L Stokes, PhD, NC Onwuche, P Thomas, PhD, JO Davies-Cole, PhD, T Calhoun, MD, AC Glymph, MPH, ME Knuckles, PhD, D Lucey, MD, District of Columbia Dept of Health. T Cote, MD, G Audain-Norwood, MA, M Britt, PhD, ML Lowe, MCRP, MA Malek, MD, A Szeto, MPH, RL Tan, DVM, C Yu, M Eberhart, MD, US Public Health Svc. MJ Brown, ScD, C Blanton, MS, GB Curtis, DM Homa, PhD, Div of Emergency and Environmental Health Svcs, National Center for Environmental Health, CDC. Editorial Note:The findings in this report indicate that although lead in tap water contributed to a small increase in BLLs in DC, no children were identified with BLLs >10µg/dL, even in homes with the highest water lead levels. In addition, the longitudinal surveillance data indicate a continued decline in the percentage of BLLs >10 µg/dL. The findings in this report suggest that levels exceeding the EPA action level of 15 ppb can result in an increase in the percentage of BLLs >5 µg/dL. Homes with lead service pipes are older, and persons living in these homes are more likely to be exposed to high-dose lead sources (e.g., paint and dust hazards). For this reason, in all years reported, the percentage of test results >10 µg/dL and the percentage of test results >5 µg/dL at addresses with lead service pipes were higher than at addresses without lead service pipes. The findings in this report are subject to at least three limitations. First, the BLL surveillance data include multiple tests on the same person, and persons with lead poisoning are tested more frequently than those with low BLLs. Second, fingerstick tests are more subject than venous samples to contamination by ambient lead (7). Finally, neither the blood nor the water lead test results were collected from a randomized sample. Water was collected from homes with a high probability of having lead service pipes; the March 2004 BLL screening program was limited to families living in homes with the highest water lead levels, and the routine blood lead surveillance program focused on identifying children at highest risk for lead exposure. For these reasons, the percentages of BLLs >5 µg/dL or >10 µg/dL reported probably are higher than those found in the general population. However, none of these factors should affect the relative differences between percentage of tests >5 µg/dL by water line type, nor do they explain the change in trajectory of the percentage of tests >5 µg/dL by year after 2000. The cause of the elevated water lead levels in DC is under review. Although the increase is associated temporally with the change in the disinfection process from chlorine to chloramines that occurred in November 2000, whether this change contributed to increased lead in the water is unknown. Because no threshold for adverse health effects in young children has been demonstrated (6), public health interventions should focus on eliminating all lead exposures in children (8). Lead concentrations in drinking water should be below the EPA action level of 15 ppb. Officials in communities that are considering changes in water chemistry or that have implemented such changes recently should assess whether these changes might result in increased lead in residential tap water. EPA has asked all state health and environmental officials to monitor lead in drinking water at schools and day care centers. More information about lead poisoning is available from CDC at http://www.cdc.gov/nceh/lead/lead.htm. Acknowledgments This report is based in part on data collected by SB Adams, LC Cooper, PhD, KJ Elenberg, JM Gusto, MPH, JE Hardin, P Karikari-Martin, MPH, L Velazquez, PharmD, AA Walker, US Public Health Svc. References
Table  Return to top. Figure  Return to top.
All MMWR HTML versions of articles are electronic conversions from ASCII text into HTML. This conversion may have resulted in character translation or format errors in the HTML version. Users should not rely on this HTML document, but are referred to the electronic PDF version and/or the original MMWR paper copy for the official text, figures, and tables. An original paper copy of this issue can be obtained from the Superintendent of Documents, U.S. Government Printing Office (GPO), Washington, DC 20402-9371; telephone: (202) 512-1800. Contact GPO for current prices. **Questions or messages regarding errors in formatting should be addressed to mmwrq@cdc.gov.Page converted: 4/1/2004 |
|||||||||
This page last reviewed 4/1/2004
|