Preventing Lead Poisoning in Young Children: Figures
- Table of Contents
- Chapter 1. Introduction
- Chapter 2. Background
- Chapter 3. Sources and Pathways of Lead Exposure
- Chapter 4. The Role of the Pediatric Health-Care Provider
- Chapter 5. The Role of State and Local Public Agencies
- Chapter 6. Screening
- Chapter 7. Diagnostic Evaluation and Medical Management of Children with Blood Lead Levels > or = to 20 µg/dL
- Chapter 8. Management of Lead Hazards in the Environment of the Individual Child
- Chapter 9. Management of Lead Hazards in the Community
- Appendix I. Capillary Sampling Protocol
- Appendix II. Summary for the Pediatric Health-Care Provider
- Tables
- Figures
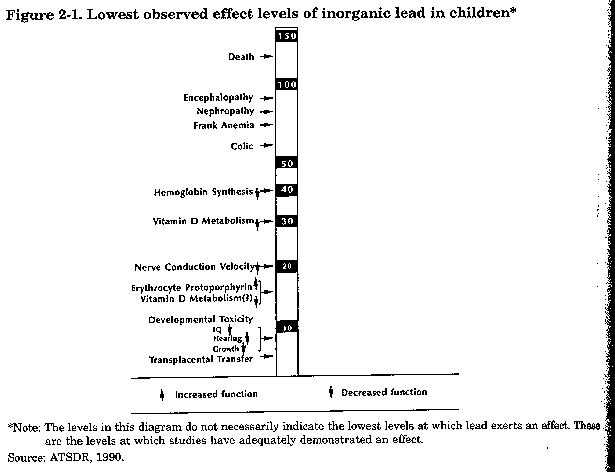
- Figure 2-1. Lowest Observed Effect Levels of Inorganic Lead in Children
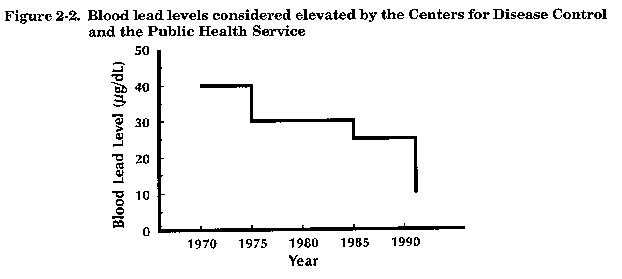
- Figure 2-2. Blood Lead Levels Considered Elevated by the Centers for Disease Control and the Public Health Service
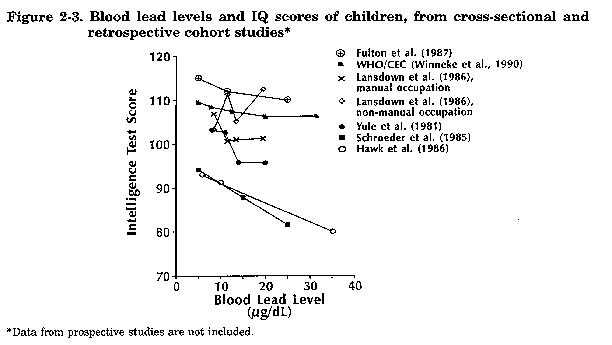
- Figure 2-3. Blood Lead Levels and IQ Scores of Children, from Cross-Sectional and Retrospective Cohort Studies
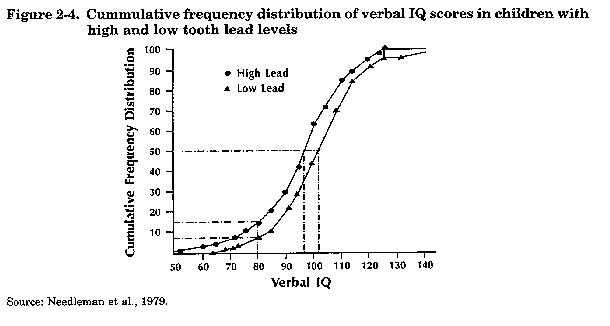
- Figure 2-4. Cumulative Frequency Distribution of Verbal IQ Scores in Children with High and Low Tooth Lead Levels
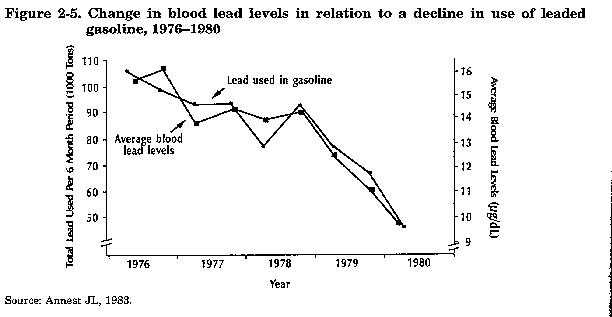
- Figure 2-5. Change in Blood Lead Levels in Relation to a Decline in Use of Leaded Gasoline, 1976-1980
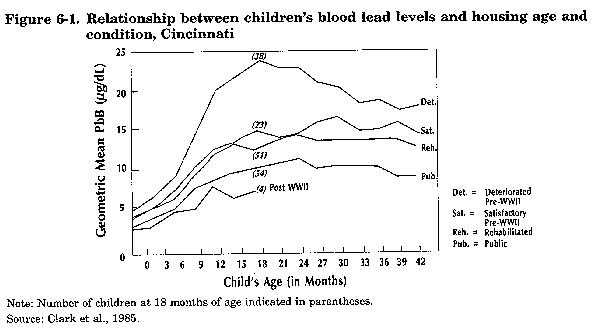
- Figure 6-1. Relationship between Children’s Blood Lead Levels and Housing Age and Condition, Cincinnati
Top of Page
Top of Page
Top of Page
Top of Page
Top of Page
Top of Page
Top of Page
- Page last reviewed: October 1, 1991
- Page last updated: October 1, 1991
- Content source:
National Center for Environmental Health, Division of Emergency and Environmental Health Services


 ShareCompartir