2015 National HIV Prevention Conference
December 6, 2015 – Major CDC Announcements at the National HIV Prevention Conference
The 2015 National HIV Prevention Conference is the only major meeting in the United States to focus exclusively on HIV prevention. Convened by CDC and partners, in Atlanta, Georgia, December 6-9, the conference brings together community leaders, public health professionals, clinicians, advocates and other interested individuals to refine, improve and strengthen the nation’s response to HIV.
CDC announced new data on trends and disparities in the U.S. HIV epidemic, which show promising developments among gay and bisexual men, heterosexuals, African American women and people who inject drugs, despite ongoing disparities and uneven progress by region, race and ethnicity.
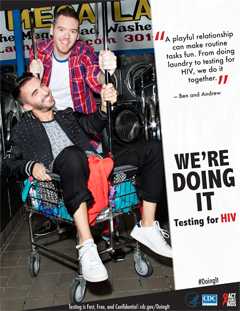
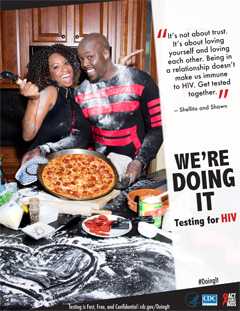
Additionally, CDC debuted a national HIV testing campaign and a new interactive risk reduction tool that allows users to access the most up-to-date HIV prevention information and explore how various sexual activities and prevention methods change the risk of infection.
CDC also released new data on the state of sex education in U.S. schools, including the percentage of middle and high schools teaching 16 essential sex education topics recommended by CDC.
Research studies on pre-exposure prophylaxis (PrEP) and HIV prevention among transgender individuals can be found in the studies of interest.
Additional information detailing notable research presented at this year’s conference will be posted throughout the week as embargos lift.
Resources
-
Press Releases:
- HIV Diagnoses Decline Almost 20 Percent, But Progress is Uneven
- Southern States Lag Behind Rest of Nation in HIV Treatment, Testing
- New CDC Efforts Offer Individuals Vital Information to Reduce Personal HIV Risk
- New findings from CDC survey suggest too few schools teach prevention of HIV, STDs, pregnancy
- Studies of Interest: 2015 National HIV Prevention Conference Studies of Interest
- Fact Sheets:
- Profiles Report: 2014 School Health Profiles
- Graphics
Graphics: Trends in U.S. HIV Diagnoses, 2005-2014
The following images and graphics highlight major findings from CDC’s analysis. These high-resolution, public domain images are ready to download and print in your publication. Click on a graphic to see it in high-resolution.
These images are in the public domain and are thus free of any copyright restrictions. As a matter of courtesy, we ask that the content provider be credited and notified of any public or private usage of an image.
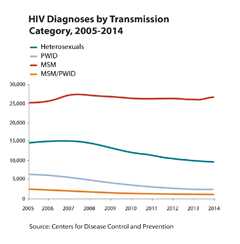 HIV Diagnoses by Transmission Category, 2005-2014
View High Resolution Version
Trend data shows that over the full decade (2005-2014) the annual number of HIV diagnoses has declined—though progress has been uneven for certain groups. Steep declines in diagnoses were seen among heterosexuals (35 percent) and people who inject drugs (PWID) (63 percent). However, diagnoses among men who have sex with men (MSM) increased by roughly six percent.
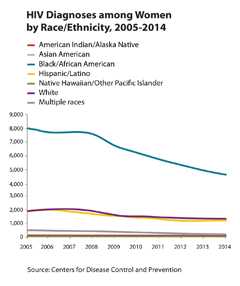 HIV Diagnoses among Women by Race/Ethnicity, 2005-2014
View High Resolution Version
Among women, diagnoses of HIV declined by 40 percent in the U.S. from 2005 to 2014. African American women achieved the largest decrease in HIV diagnoses with a 42 percent decline since 2005. However, African American women continue to be disproportionately affected by HIV, accounting for six in 10 diagnoses among women in 2014. Steady declines in diagnoses among Latino and white women also occurred over the decade.
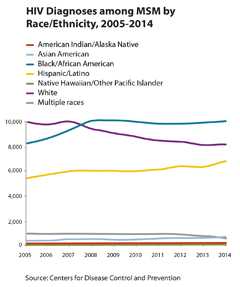 HIV Diagnoses among MSM by Race/Ethnicity, 2005-2014
View High Resolution Version
Gay, bisexual, and other men who have sex with men (MSM) continue to be the group most heavily affected by HIV in the United States. From 2005-2014, HIV diagnoses among MSM overall increased by roughly six percent. Trends in HIV diagnoses over the decade varied considerably by race and ethnicity, with increased HIV diagnoses among Latino (24 percent) and among black MSM (22 percent), and decreased diagnoses among white MSM (18 percent). Concerning increases in diagnoses were also seen among Asian Americana and Indian/Alaska Native MSM, though the overall number of diagnoses was small.
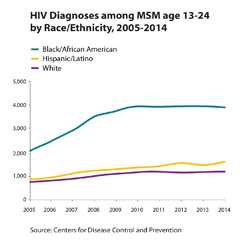 HIV Diagnoses among MSM age 13-24 by Race/Ethnicity, 2005-2014
View High Resolution Version
Steep increases in HIV diagnoses between 2005 and 2014, occurred among young men black and Latino MSM aged 13-24. Both populations saw increases in diagnoses of about 87 percent over the decade. Diagnoses among young white MSM aged 13-24 increased by 56 percent.
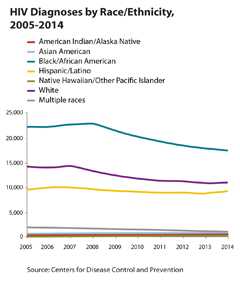 HIV Diagnoses by Race/Ethnicity, 2005-2014
View High Resolution Version
From 2005-2014, African Americans, Latinos, and whites all saw decreases in diagnoses. Despite recent progress, African Americans, more than any other racial or ethnic population, continue to be disproportionately affected by HIV in the United States. In 2014 African Americans accounted for almost half (44 percent) of all new HIV diagnoses and Latinos accounted for nearly a quarter (23 percent). Additionally, declines in diagnoses have stalled over the most recent five-year period for Latinos.
Graphics: Regional Disparities in the U.S. HIV Epidemic
The following images and graphics highlight major findings from CDC’s analysis. These high-resolution, public domain images are ready to download and print in your publication. Click on a graphic to see it in high-resolution.
These images are in the public domain and are thus free of any copyright restrictions. As a matter of courtesy, we ask that the content provider be credited and notified of any public or private usage of an image.
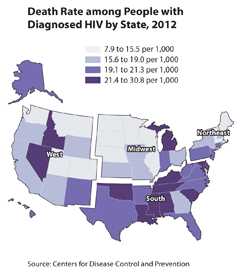 Death Rates among People with Diagnosed HIV by State, 2012
View High Resolution Version
Across the nation, Southern states bear the greatest burden of HIV infection, illness, and death. One of goal of the National HIV/AIDS Strategy for the U.S. is for states to reduce the death rate among persons living with a diagnosed HIV infection by 2015. Of the 10 states across the U.S. that had not met the goal by 2012, seven were in the South.
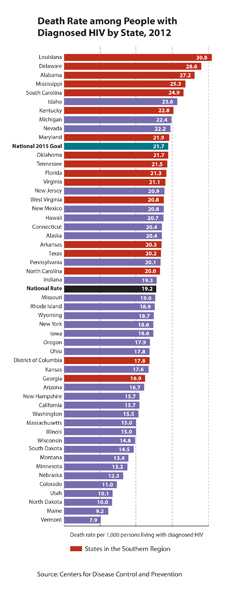 Death Rate among People with Diagnosed HIV by State, 2012
View High Resolution Version
Across the nation, Southern states bear the greatest burden of HIV infection, illness, and death. People living in with HIV in some Southern states have death rates that are three times higher than people living with HIV in some other states.
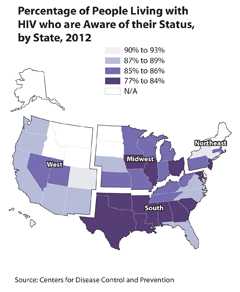 Percentage of People Living with HIV who are Aware of their Status, by State, 2012
View High Resolution Version
People living with HIV in the South are less likely to be aware of their infection than those living in other U.S. regions. Nationally, 87 percent of Americans living with HIV knew their HIV status in 2012. 70 percent of the worst performing states for individuals being aware of their HIV status were states in the South.
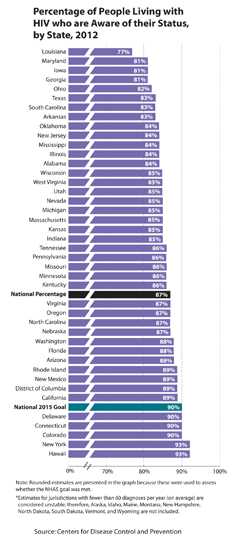 Percentage of People Living with HIV who are Aware of their Status, by State, 2012
View High Resolution Version
People living with HIV in the South are less likely to be aware of their infection than those living in other U.S. regions. Southern states have lower levels of awareness among people living with HIV of their HIV status.
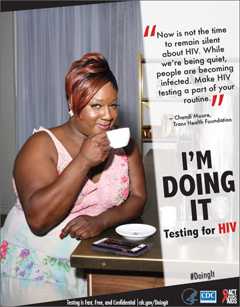
Doing It
Click an image below to see and download a high-resolution PDF version. These images are in the public domain and are thus free of any copyright restrictions. As a matter of courtesy, we ask that the content provider be credited and notified of any public or private usage of an image. Additional campaign images can be found on the Doing It Campaign Site.
- Page last reviewed: December 9, 2015
- Page last updated: December 9, 2015
- Content source:


 ShareCompartir
