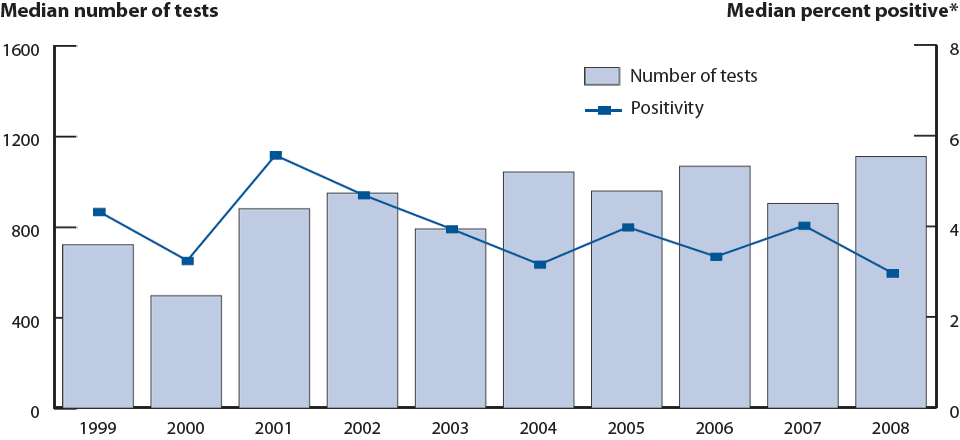
Figure Y. MSM Prevalence Monitoring Project —Clinic-specific median number of HIV tests and positivity among men who have sex with men, STD clinics, 1999–2008
This web page is archived for historical purposes and is no longer being updated. Newer data is available on the STD Data and Statistics page.

* Excludes persons previously known to be HIV-positive.
NOTE: The bar graph uses the scale on the left. The line graph uses the scale on the right.
- Page last reviewed: November 16, 2009 (archived document)
- Content source:


 ShareCompartir