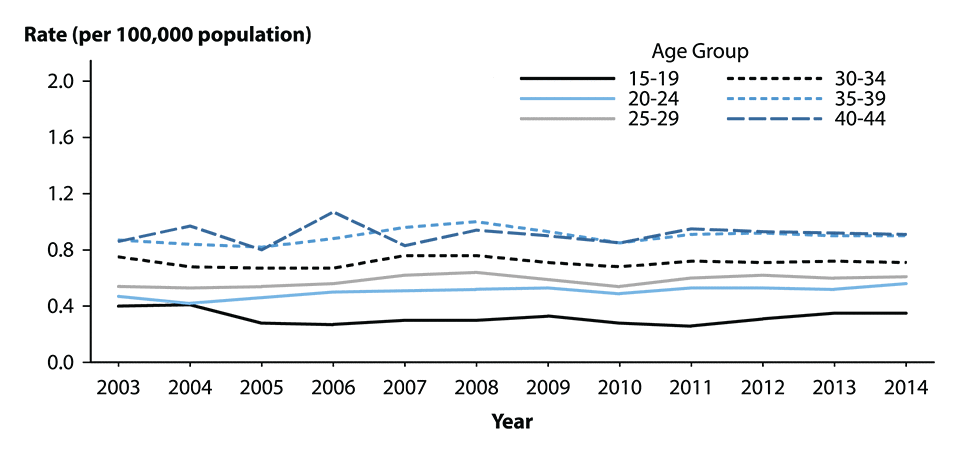
Figure G. Ectopic Pregnancy — Rates Among Commercially Insured Pregnant Women Aged 15–44 Years by Age Group, 2003–2014
This web page is archived for historical purposes and is no longer being updated. Newer data is available on the STD Data and Statistics page.

SOURCE: MarketScan Commercial Claims and Encounters Database, Truven Health Analytics, Ann Arbor, MI, 2003–2014.
- Page last reviewed: October 6, 2016 (archived document)
- Content source:


 ShareCompartir