

Figure 34. Primary and Secondary Syphilis — Rates of Reported Cases by Sex and Male-to-Female Rate Ratios, United States, 1990–2016
 ShareCompartir
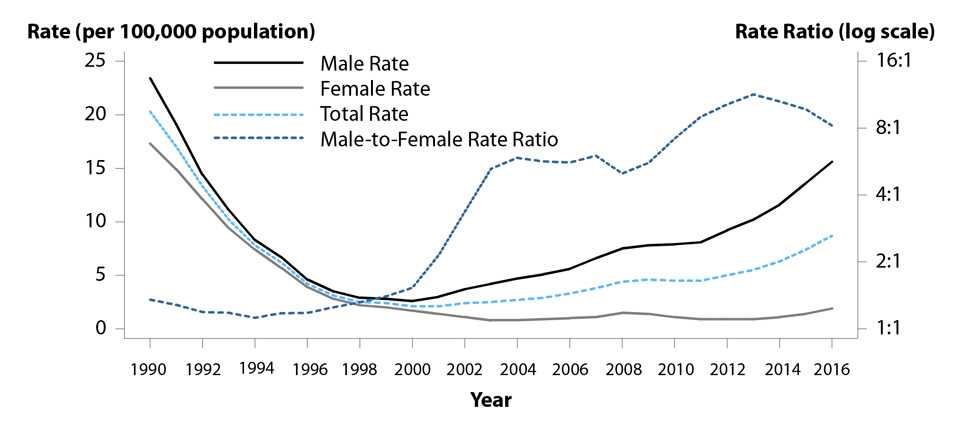
The data represented in this figure can be downloaded at www.cdc.gov/std/stats16/figures/OtherFigureData.zip.
- Page last reviewed: September 26, 2017
- Page last updated: September 26, 2017
- Content source: