

Figure 43. Primary and Secondary Syphilis — Percentage of Reported Cases* by Sex, Sexual Behavior, and Selected Reporting Sources, United States, 2016
 ShareCompartir
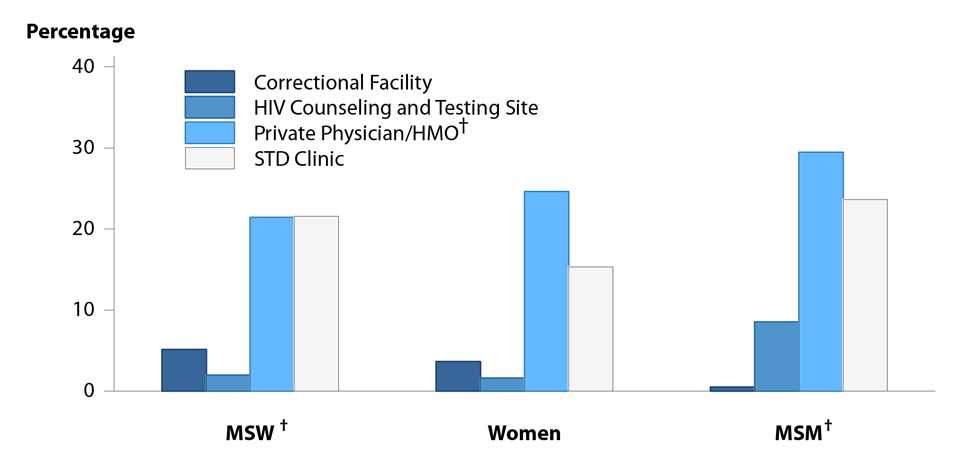
* Of all primary and secondary cases, 9.5% had a missing or unknown reporting source. Among all cases with a known reporting source, the reporting source categories presented represent 57.6% of cases; 42.4% were reported from sources other than those shown.
† HMO = health maintenance organization; MSM = Gay, bisexual, and other men who have sex with men (collectively referred to as MSM); MSW = Men who have sex with women only.
The data represented in this figure can be downloaded at www.cdc.gov/std/stats16/figures/OtherFigureData.zip.
- Page last reviewed: September 26, 2017
- Page last updated: September 26, 2017
- Content source: