

Figure 46. Human Papillomavirus — Cervicovaginal Prevalence of Types 6, 11, 16 and 18 Among Females Aged 14–34 Years by Age Group and Time Period, National Health and Nutrition Examination Survey (NHANES), 2003–2006 and 2009–2012
 ShareCompartir
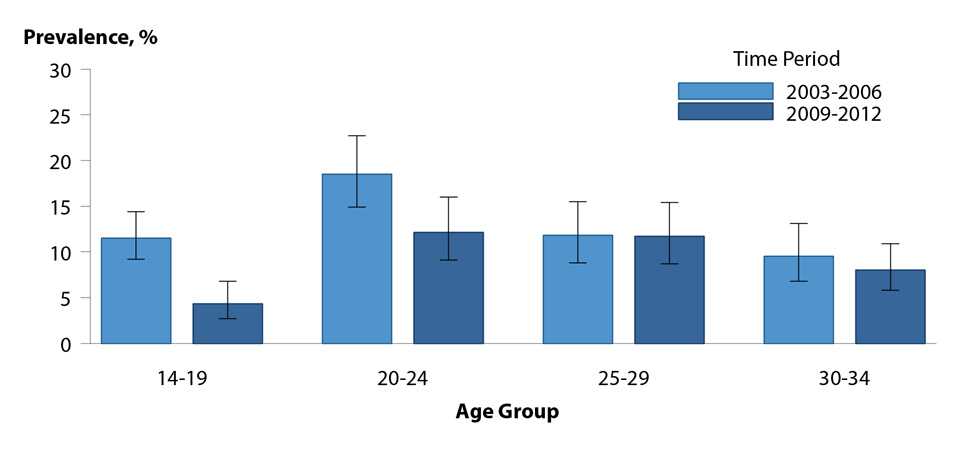
NOTE: Error bars indicate 95% confidence interval.
SOURCE: Markowitz LE, Liu G, Hariri S, et al. Prevalence of HPV after introduction of the vaccination program in the United States. Pediatrics 2016;137(3):e20151968.
The data represented in this figure can be downloaded at www.cdc.gov/std/stats16/figures/OtherFigureData.zip.
- Page last reviewed: September 26, 2017
- Page last updated: September 26, 2017
- Content source: