

Figure 48. Genital Warts — Prevalence per 1000 Person-Years Among Enrollees in Private Health Plans Aged 10–39 Years by Sex, Age Group, and Year, 2003–2010
 ShareCompartir
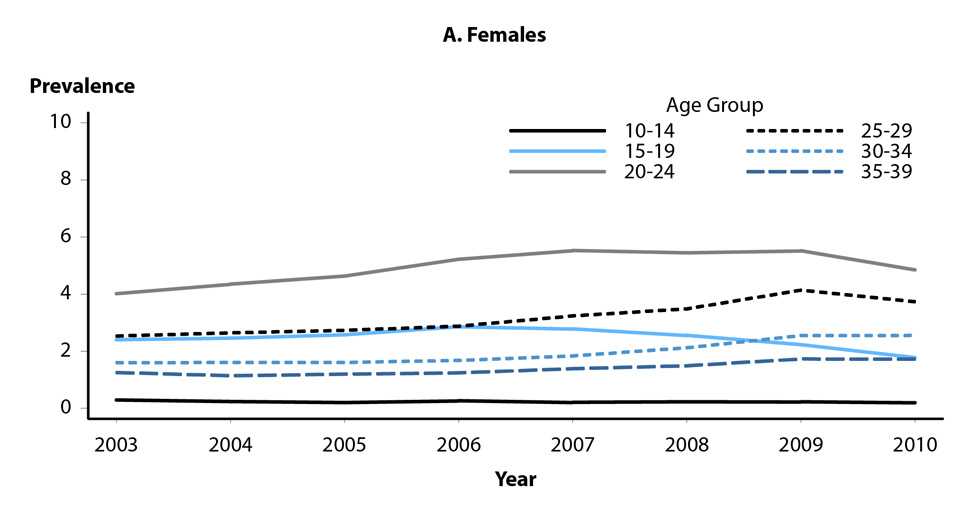
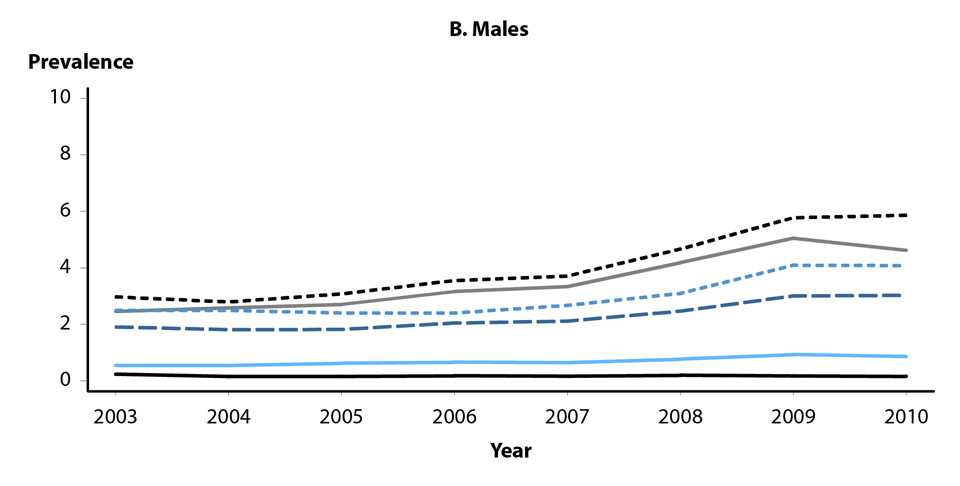
SOURCE: Flagg EW, Schwartz R, Weinstock H. Prevalence of Anogenital Warts Among Participants in Private Health Plans in the United States, 2003–2010: Potential Impact of Human Papillomavirus Vaccination. Am J Public Health 2013; 103(8):1428–1435.
The data represented in this figure can be downloaded at www.cdc.gov/std/stats16/figures/OtherFigureData.zip.
- Page last reviewed: September 26, 2017
- Page last updated: September 26, 2017
- Content source: