

Figure FF. Proportion* of MSM† Attending STD Clinics with Primary and Secondary Syphilis‡, Urogenital§ Gonorrhea, or Urogenital§ Chlamydia by HIV Statusǁ, STD Surveillance Network (SSuN), 2016
 ShareCompartir
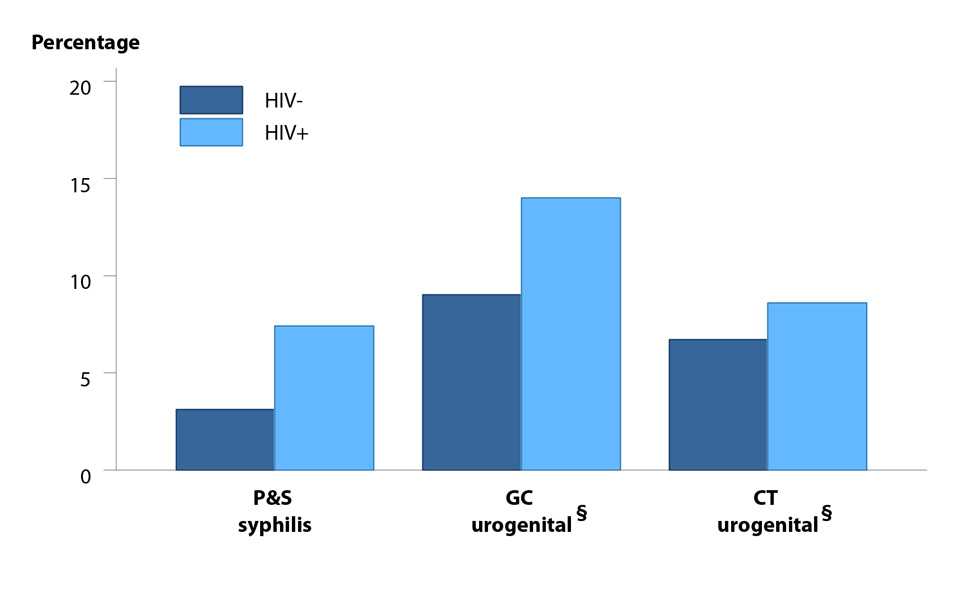
* Proportions represent the overall average of the mean value by jurisdiction.
† MSM = Gay, bisexual, and other men who have sex with men (collectively referred to as MSM).
‡ Includes SSuN jurisdictions that reported data on at least 20 patients with a diagnosis of primary and secondary syphilis in 2016.
§ Urogenital includes results from both urethral and urine specimens.
ǁ Excludes all persons for whom there was no laboratory documentation or self-report of HIV status.
NOTE: See section A2.2 in the Appendix for SSuN methods.
The data represented in this figure can be downloaded at www.cdc.gov/std/stats16/figures/OtherFigureData.zip
- Page last reviewed: September 26, 2017
- Page last updated: September 26, 2017
- Content source: