

Figure G. Chlamydia and Gonorrhea — Rates of Reported Cases Among Infants <1 Year of Age by Year and Specimen Source, United States, 2010–2015
 ShareCompartir
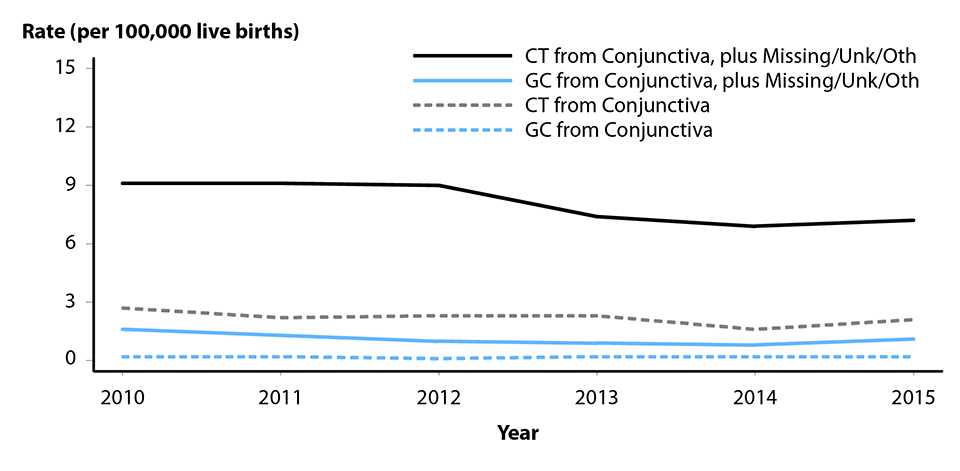
NOTE: CT = Chlamydia; GC = Gonorrhea.
SOURCE: Kreisel, K, Weston, E, Braxton, et al. Keeping an eye on chlamydia and gonorrhea conjunctivitis in infants in the United States, 2010–2015. Sex Transm Dis 2017; 44(6): 356–358.
- Page last reviewed: September 26, 2017
- Page last updated: September 26, 2017
- Content source: