

Figure L. Gonorrhea — Rates of Reported Cases Among Women Aged 15–24 Years by State, United States and Outlying Areas, 2016
 ShareCompartir
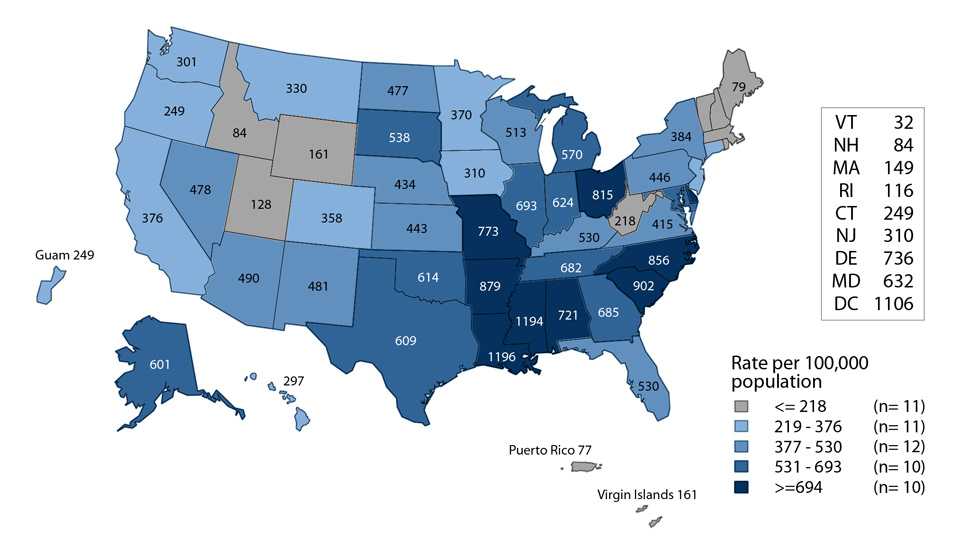
NOTE: Rates for Guam and the Virgin Islands were calculated by using the 2010 population estimates (see Section A1.2 in the Appendix).
- Page last reviewed: September 26, 2017
- Page last updated: September 26, 2017
- Content source: