Crash Deaths
Where the US Stands
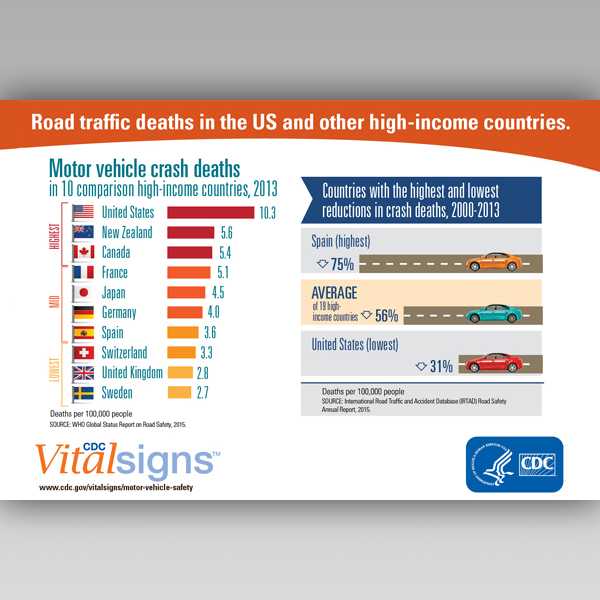
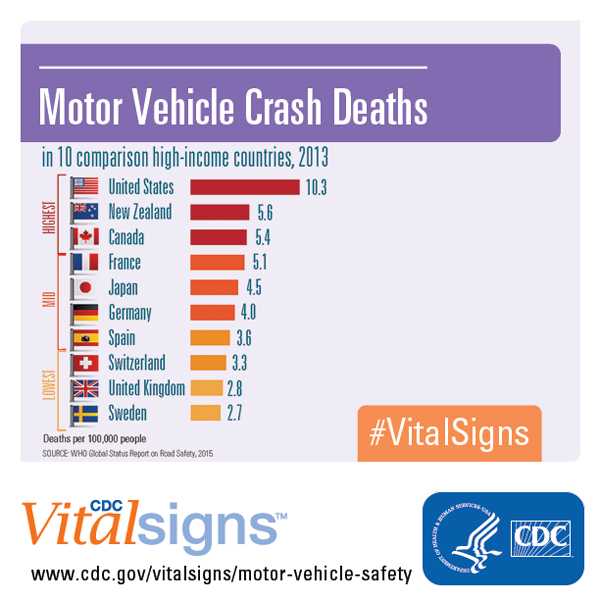
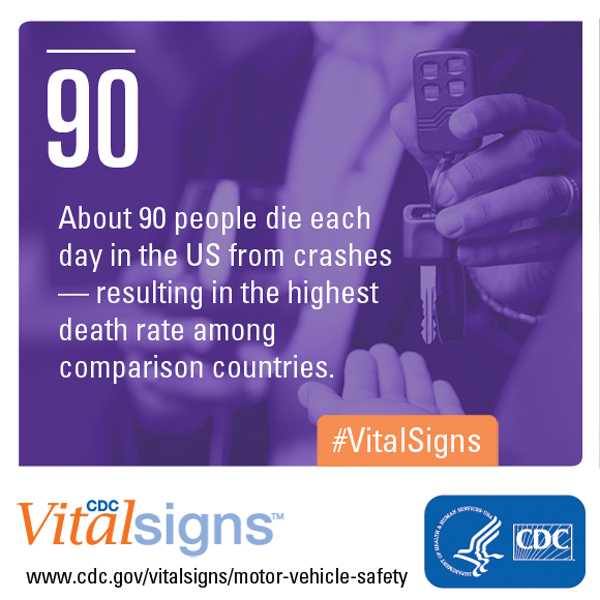
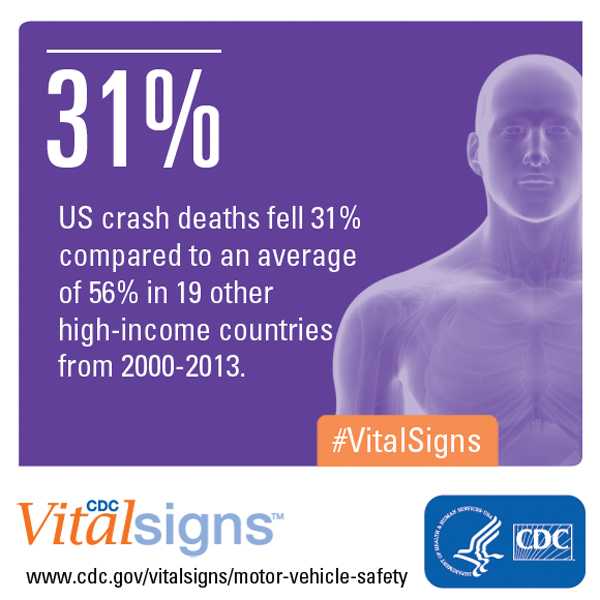
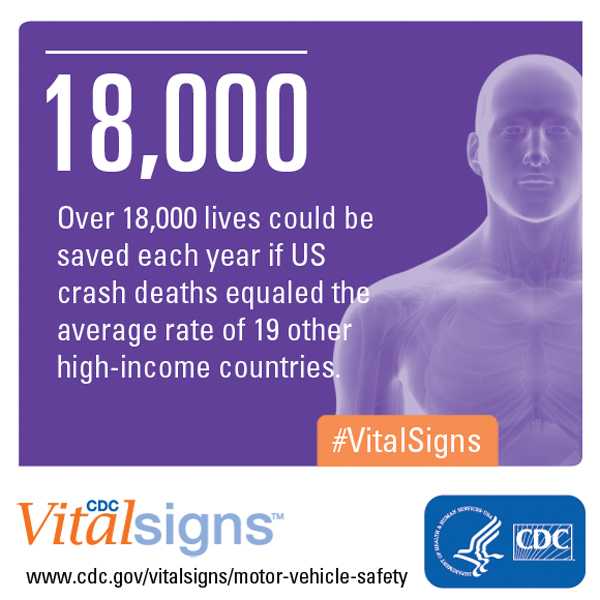
In the United States about 90 people die each day from motor vehicle crashes, resulting in the highest death rate among 19 high-income comparison countries. Our nation has made progress in road safety, reducing crash deaths by 31 percent from 2000 to 2013. But other high-income countries reduced crash deaths even further—by an average of 56 percent during the same period of time.
Compared with other high-income countries, the US had the:
- most motor vehicle crash deaths per 100,000 population and per 10,000 registered vehicles;
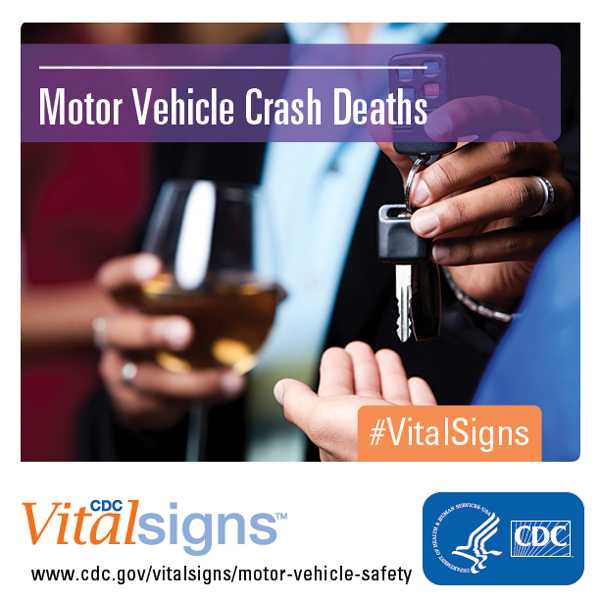
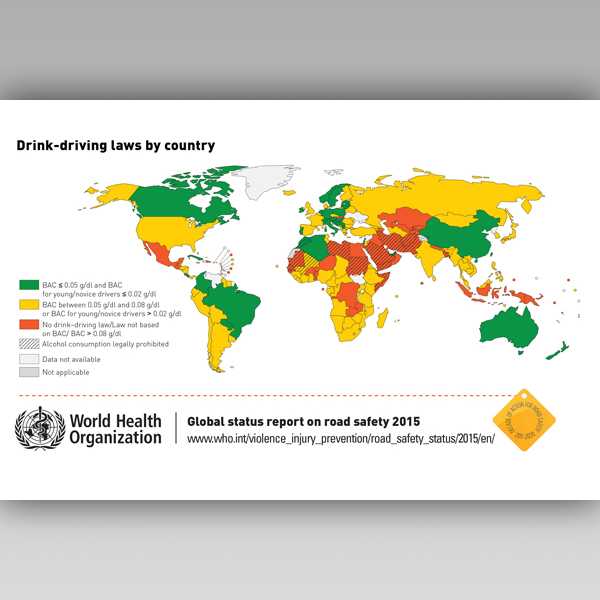
- second highest percentage of deaths involving alcohol; and
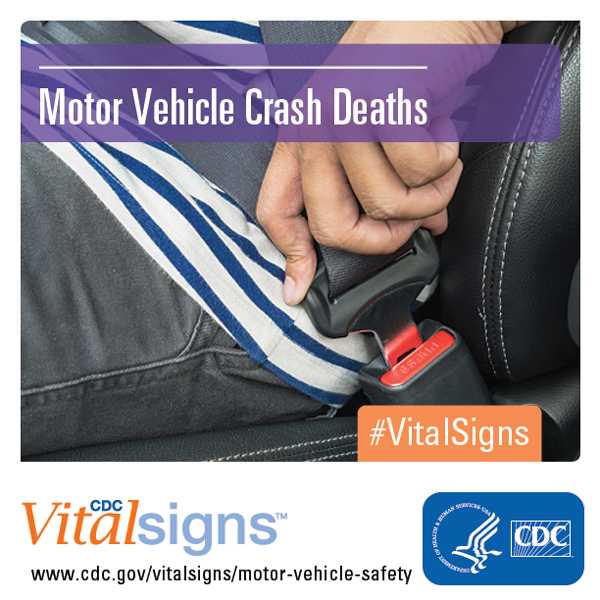
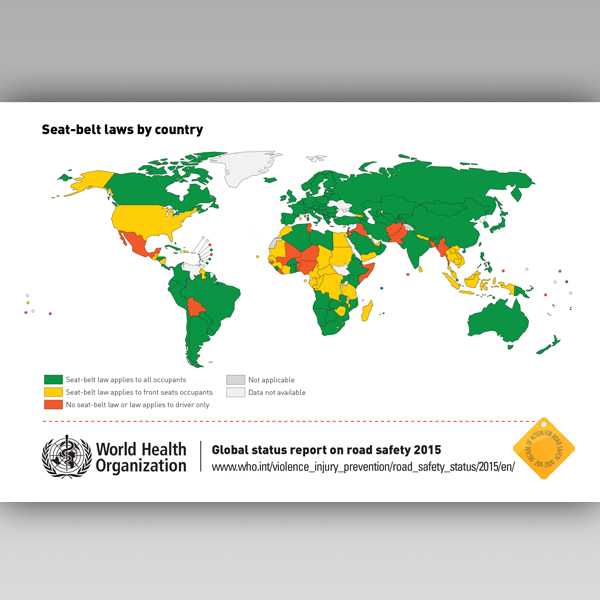
- third lowest front seat belt use.
These findings highlight key areas where the US can achieve more progress. Implementing proven measures to prevent motor vehicle crashes, injuries, and deaths can save thousands of lives each year.
Contact Information
CDC Media Relations
(404) 639-3286
media@cdc.gov
Vital Signs Links
Factsheet:
English [3.17MB]
Spanish [3.03MB]
Spokespersons
Debra E. Houry, MD, MPH
“It is important to compare us not to our past but to our potential. Seeing that other high-income countries are doing better, we know we can do better too,” said Debra Houry, M.D., M.P.H., director of CDC’s National Center for Injury Prevention and Control. “People of our nation deserve better and safer transport.”
Debra E. Houry, MD, MPH – Director, National Center for Injury Prevention and Control
Erin K. Sauber-Schatz, PhD, MPH
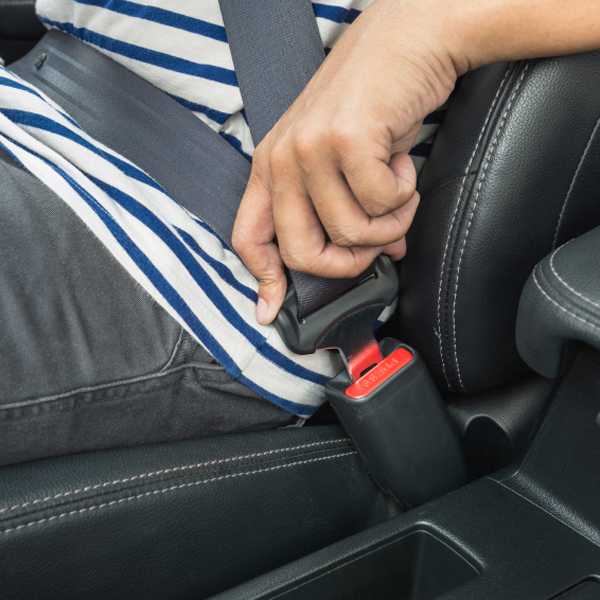
“It’s unacceptable for 90 people to die on our roads each day, especially when we know what works to prevent crashes, injuries, and deaths,” said Erin Sauber-Schatz, Ph.D., M.P.H., transportation safety team lead, CDC’s National Center for Injury Prevention and Control. “About 3,000 lives could be saved each year by increasing seat belt use to 100 percent and up to 10,000 lives could be saved each year by eliminating alcohol-impaired driving.”
Erin K. Sauber-Schatz, PhD, MPH – (CDR US) Public Health Service, Transportation Safety Team Lead
Related Links
Most Relevant
- Press Release: Motor vehicle crash fatalities in the U.S. could drop by half with proven strategies – English | Spanish
- MMWR –Vital Signs: Motor Vehicle Injury Prevention — United States and 19 Comparison Countries
- Vital Signs: Home | July 2016 Vital Signs | Fact Sheet PDF 3.17 MB | Topics
- Vital Signs: (Spanish) Home | 2016 Julio – Signos Vitales | Fact Sheet PDF 3.03MB | Topics
CDC Related Links
- Motor Vehicle Safety
- State-based Costs of Motor Vehicle Crash Deaths
- Vital Signs: Motor Vehicle Crash Injuries
- Vital Signs: Child Passenger Safety
- Child Passenger Safety
- Seat Belts
- Impaired Driving
- Increasing Alcohol Ignition Interlock Use: Successful Practices for States
- Sobering Facts: Drunk Driving State Fact Sheets
- Teen Drivers
- Global Road Safety
- Prevention Status Reports: Motor Vehicle Injuries
- The Community Guide: Motor Vehicle-Related Injury Prevention
- WISQARS (Web-based Injury Statistics Query and Reporting System)
- Motor Vehicle PICCS (Prioritizing Interventions and Cost Calculator for States)
- Story Ideas: NIOSH publishes report on seat belt use among adult workers
Additional Resources
- World Health Organization: Global Status Report on Road Safety 2015
- Vision Zero
- Vision Zero Network
- National Highway Traffic Safety Administration (NHTSA)
- Safe Kids Worldwide: Find a Child Passenger Safety Technician
- Substance Abuse and Mental Health Services Administration: The Dangers of Underage Drinking and Driving
- MedlinePlus – Motor Vehicle Safety
- MedlinePlus – Impaired Driving
- NHTSA – Countermeasures That Work
- Official U.S. Government Website for Distracted Driving
Multimedia
Podcast
- Vital Signs – Motor Vehicle Injury Prevention —United States and 19 Comparison Countries – English | Spanish
- Vital Signs – Motor Vehicle Injury Prevention —United States and 19 Comparison Countries – [PSA – 0:60 seconds]
- Motor Vehicle Crash Injuries [PSA – 0:60 seconds]
- Page last reviewed: July 6, 2016
- Page last updated: July 6, 2016
- Content source:


 ShareCompartir
