Infographics (Information Graphics) are visual representations of data, information or knowledge that tell a story through visual communication. Below are a series of infographics related to sodium and sodium reduction. You can copy and paste the code to embed the Infographics in your Web sites, social network profiles, and blogs.
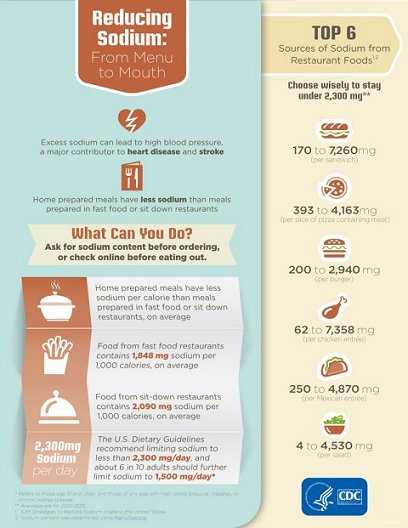
Copy the code below to use the Reducing Sodium: From Menu to Mouth Infographic (800x1035) on your web page or social media page.
Copy the code below to use the Reducing Sodium: From Menu to Mouth Infographic (800x1035) on your web page or social media page.
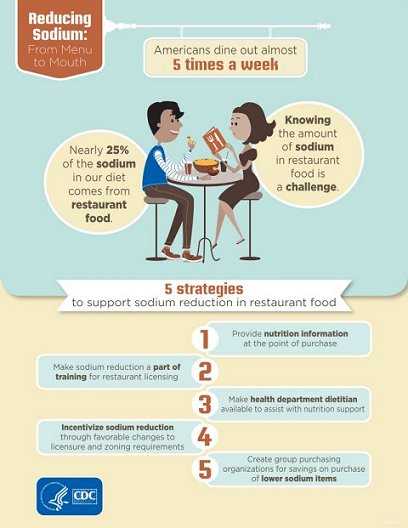
<a href="https://www.cdc.gov/salt/?s_cid=infographic-sodium-02&utm;_campaign=2014 Sodium Infographics&utm;_medium=infographic&utm;_source=external&utm;_content=infographic-sodium-02" title="Reducing Sodium: From Menu to Mouth. Americans dine out almost 5 times a week. Knowing the amount of sodium in restaurant food is a challenge. Nearly 25% of the sodium in our diet comes from restaurant food. 5 strategies to support sodium reduction in restaurant food: 1. Provide nutrition information at the point of purchase. 2. Make sodium reduction a part of training for restaurant licensing. 3. Make health department dietitian available to assist with nutrition support. 4. Incentivize sodium reduction through favorable changes to licensure and zoning requirements. 5. Create group purchasing organizations for savings on purchase of lower sodium items. Department of Health and Human Services, Centers for Disease Control and Prevention."><img src="https://www.cdc.gov/salt/images/Sodium_Menu_to_Mouth1.jpg" style="width:800px; height:1035px; border:0px;" alt="Reducing Sodium: From Menu to Mouth. Americans dine out almost 5 times a week. Knowing the amount of sodium in restaurant food is a challenge. Nearly 25% of the sodium in our diet comes from restaurant food. 5 strategies to support sodium reduction in restaurant food: 1. Provide nutrition information at the point of purchase. 2. Make sodium reduction a part of training for restaurant licensing. 3. Make health department dietitian available to assist with nutrition support. 4. Incentivize sodium reduction through favorable changes to licensure and zoning requirements. 5. Create group purchasing organizations for savings on purchase of lower sodium items. Department of Health and Human Services, Centers for Disease Control and Prevention." /></a>
Copy the code below to use the Reducing Sodium: From Menu to Mouth Infographic (800x1035) on your web page or social media page.
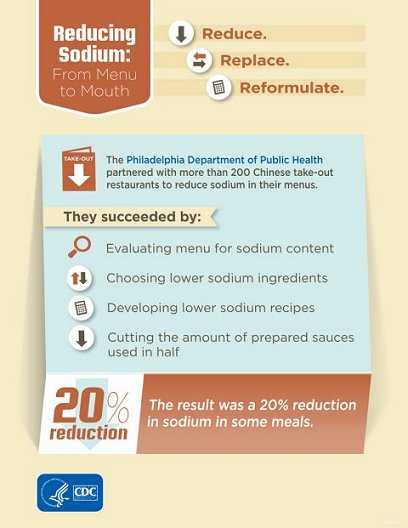
<a href="https://www.cdc.gov/salt/?s_cid=infographic-sodium-03&utm;_campaign=2014 Sodium Infographics&utm;_medium=infographic&utm;_source=external&utm;_content=infographic-sodium-03" title="Reduce. Replace. Reformulate. Reducing Sodium: From Menu to Mouth. The Philadelphia Department of Public Health partnered with more than 200 Chinese take-out restaurants to reduce sodium in their menus. They succeeded by: 1. Evaluating menu for sodium content ; 2. Choosing lower sodium ingredients; 3. Developing lower sodium recipes; and 4. Cutting the amount of prepared sauces used in half. The result was a 20% reduction in sodium in some meals. Department of Health and Human Services, Centers for Disease Control and Prevention."><img src="https://www.cdc.gov/salt/images/Sodium_Menu_to_Mouth1.jpg" style="width:800px; height:1035px; border:0px;" alt="Reduce. Replace. Reformulate. Reducing Sodium: From Menu to Mouth. The Philadelphia Department of Public Health partnered with more than 200 Chinese take-out restaurants to reduce sodium in their menus. They succeeded by: 1. Evaluating menu for sodium content ; 2. Choosing lower sodium ingredients; 3. Developing lower sodium recipes; and 4. Cutting the amount of prepared sauces used in half. The result was a 20% reduction in sodium in some meals. Department of Health and Human Services, Centers for Disease Control and Prevention." /></a>
Copy the code below to use the Tracking Down the Salt in Food with Professor Saul T. infographic (1543x1324) on your web page or social media page.
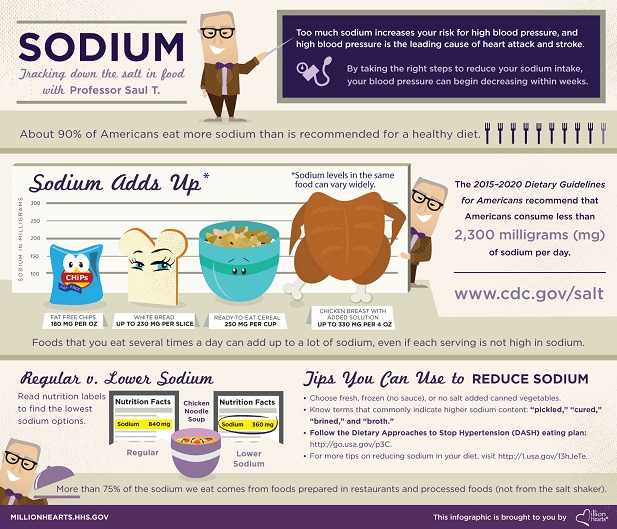
<a href="https://www.cdc.gov/salt/infographic.htm?s_cid=info-salt-01&utm;_campaign=Sodium Infographic&utm;_medium=infographic&utm;_source=external&utm;_content=info-salt-01" title="Tracking down the salt in food with Professor Saul T. Too much sodium increases your risk for high blood pressure, and high blood pressure is the leading cause of heart attack and stroke. By taking the right steps to reduce your sodium intake, your blood pressure can begin decreasing within weeks. About 90% of Americans eat more sodium than is recommended for a healthy diet. The 2015-2020 Dietary Guidelines for Americans recommend that Americans consume less than 2,300 milligrams of sodium per day. Sodium adds up, and sodium levels in the same food can vary widely. Fat free chips can have 180 milligrams per ounce; white bread, up to 230 milligrams per slice; ready-to-eat cereal, 250 milligrams per cup; chicken breast with added solution, up to 330 milligrams per 4 ounces. Foods that you eat several times a day can add up to a lot of sodium, even if each serving is not high in sodium. Read nutrition labels to find the lowest sodium options. A bowl of regular chicken noodle soup can have 840 milligrams of sodium, but lower sodium chicken noodle soup can have 360 milligrams. More than 75% of the sodium we eat comes from foods prepared in restaurants and processed foods (not from the salt shaker). Tips you can use to reduce sodium: Choose fresh, frozen (no sauce), or no salt added canned vegetables; know terms that commonly indicate higher sodium content, like “pickled,” “cured,” “brined,” and “broth”; follow the Dietary Approaches to Stop Hypertension (DASH) eating plan at https://go.usa.gov/p3C. For more tips on reducing sodium in your diet, visit http://1.usa.gov/13hJeTe. This infographic is brought to you by Million Hearts®, millionhearts.hhs.gov" /></a>


 ShareCompartir