

RSV Census Division Trends
 ShareCompartir
« Back to Respiratory Syncytial Virus (RSV) Surveillance
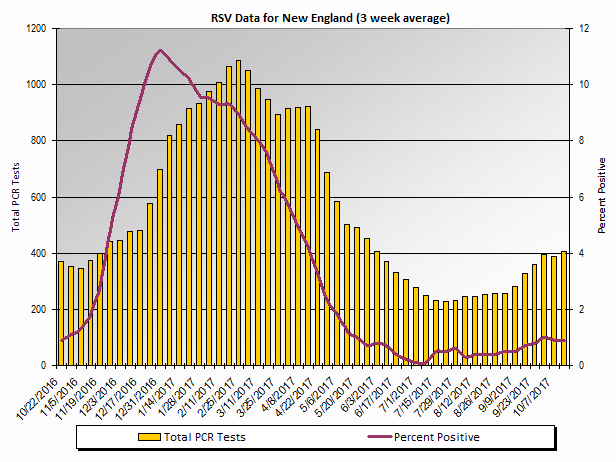
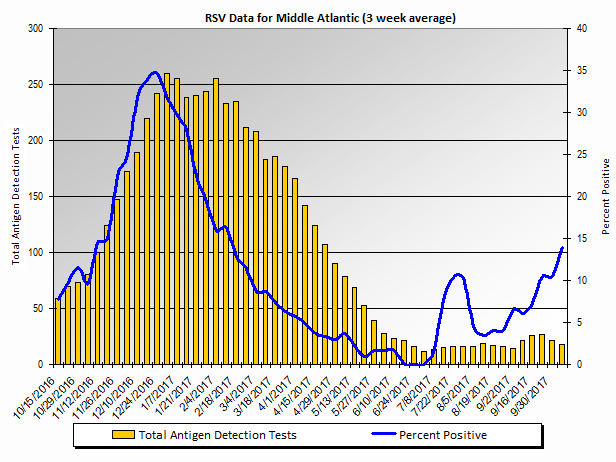
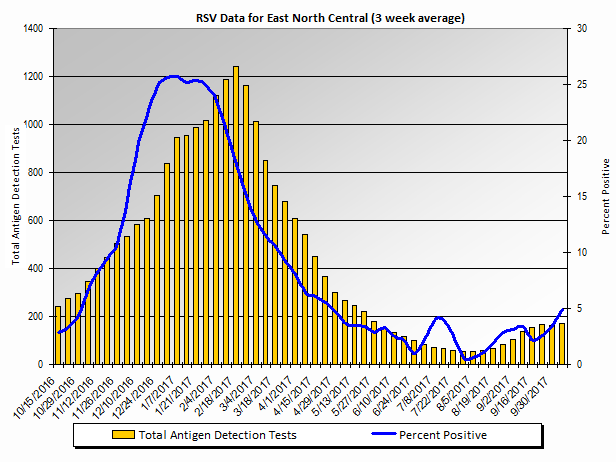
Participating laboratories report weekly to CDC the total number of RSV tests performed that week, and the number of those tests that were positive. Because reporting delays may be expected for some laboratories, data shown for the more recent weeks may be less complete than others. Each point on the trend graphs below displays the average number of RSV tests that were performed, and the average percent of those that were positive from three adjacent weeks: the specified week, and the weeks preceding and following it. This is also known as a centered 3-week moving average.
In the United States, RSV infections typically occur at the time of annual community outbreaks, during late fall, winter, and early spring. There may be variation in the timing of outbreaks between regions, and between communities in the same region.

About Census Regions and Divisions [1 MB, 2 pages]
New England Census Division
Total Antigen Detection Tests
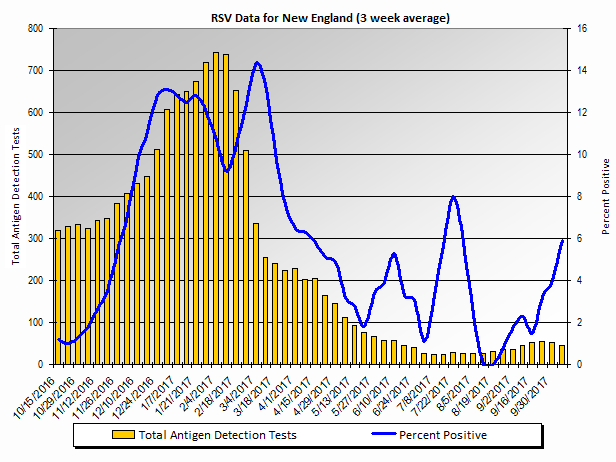
Table: New England percent positive antigen detection RSV tests, by 3 week moving average
Middle Atlantic Census Division
Total Antigen Detection Tests
Total PCR Tests
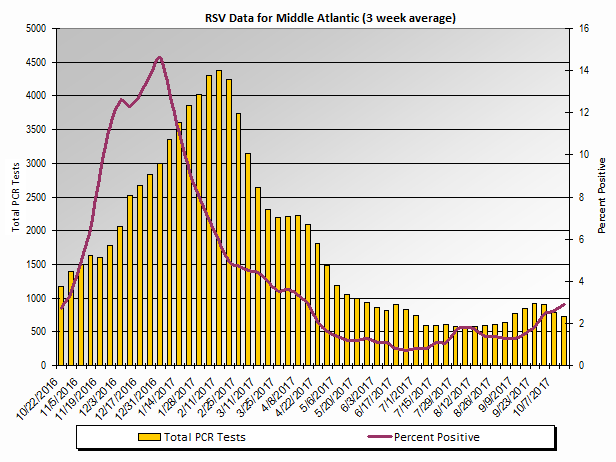
Table: Middle Atlantic Census Division percent positive RSV PCR tests, by 3 week moving average
East North Central Census Division
Total Antigen Detection Tests
Total PCR Tests
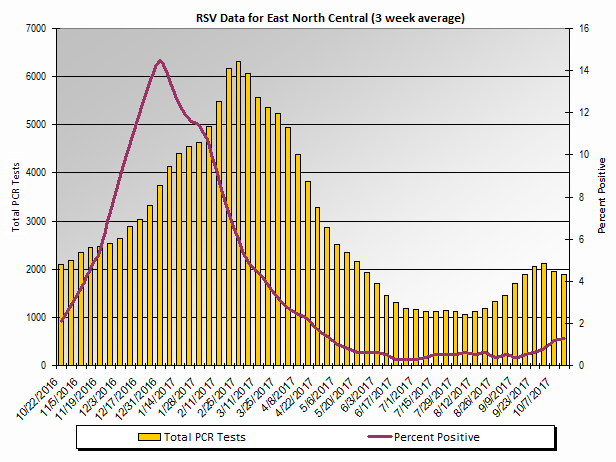
Table: East North Central Census Division percent positive RSV PCR tests, by 3 week moving average
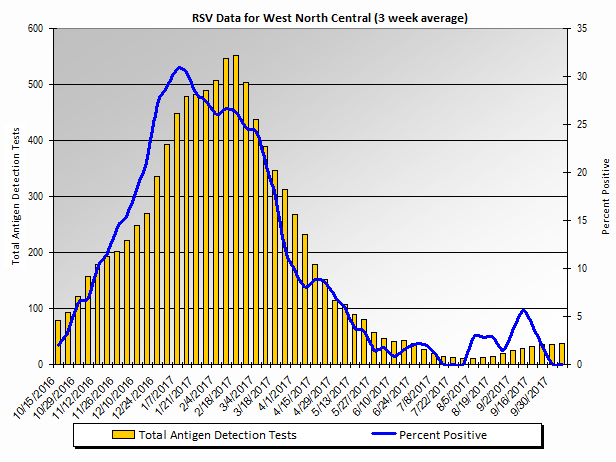
West North Central Census Division
Total Antigen Detection Tests
Total PCR Tests
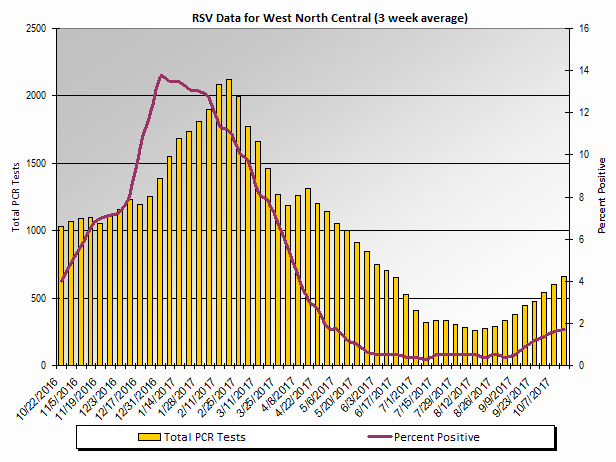
Table: West North Central Census Division percent positive RSV PCR tests, by 3 week moving average
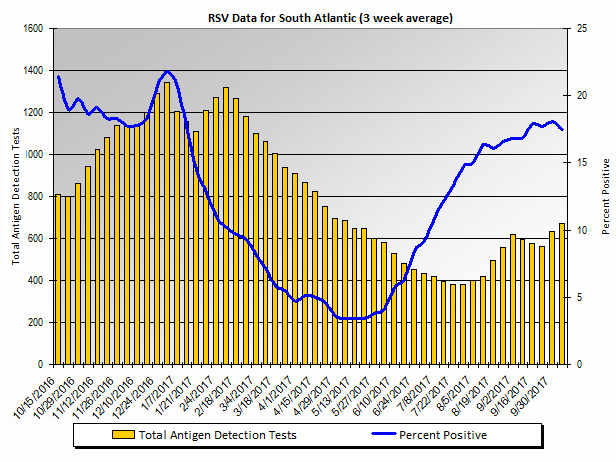
South Atlantic Census Division
Total Antigen Detection Tests
Total PCR Tests
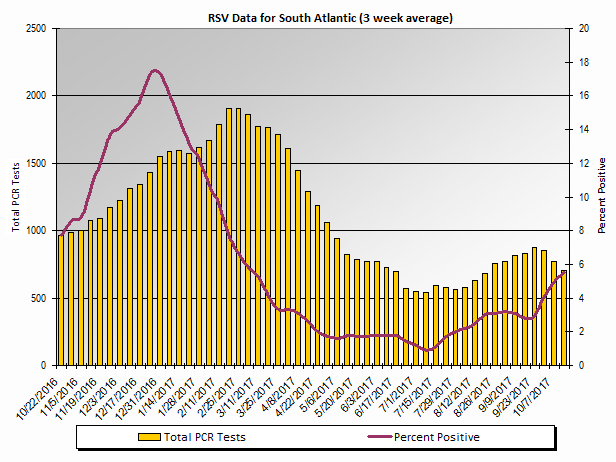
Table: South Atlantic Census Division percent positive RSV PCR tests, by 3 week moving average
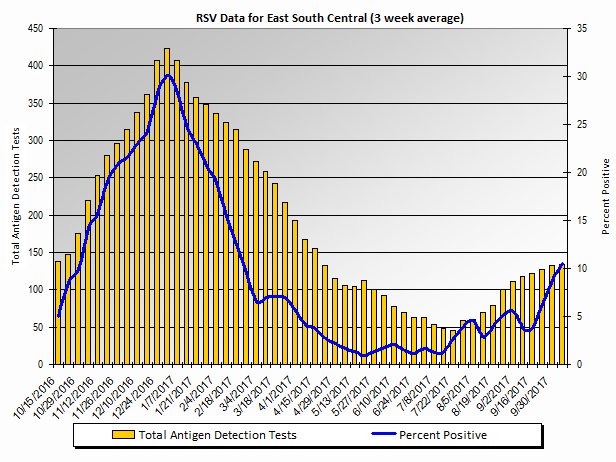
East South Central Census Division
Total Antigen Detection Tests
Total PCR Tests
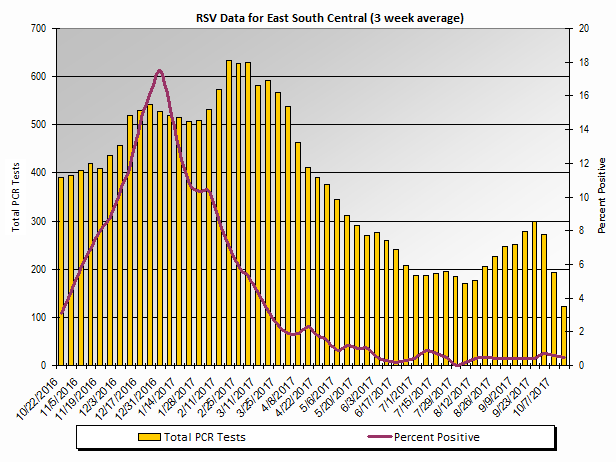
Table: East South Central Census Division percent positive RSV PCR tests, by 3 week moving average
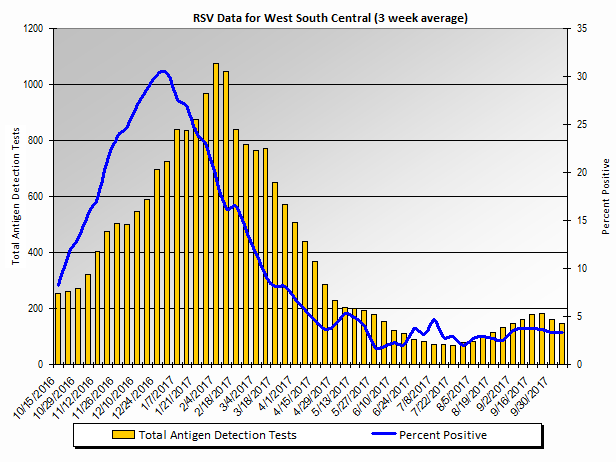
West South Central Census Division
Total Antigen Detection Tests
Total PCR Tests
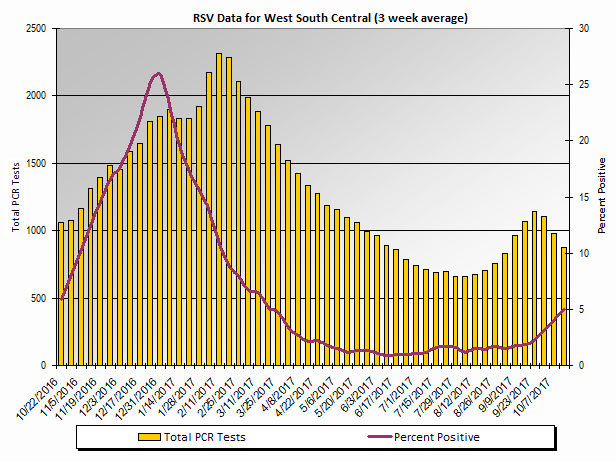
Table: West South Central Census Division percent positive RSV PCR tests, by 3 week moving average
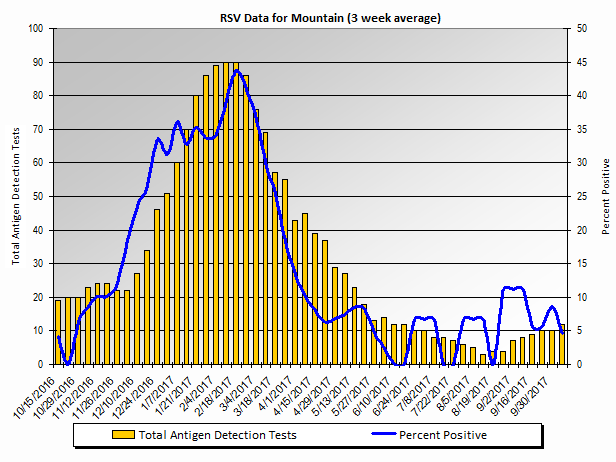
Mountain Census Division
Total Antigen Detection Tests
Total PCR Tests
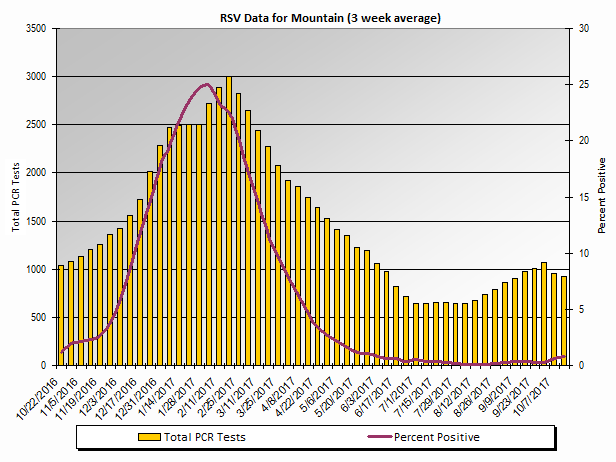
Table: Mountain Census Division percent positive RSV PCR tests, by 3 week moving average
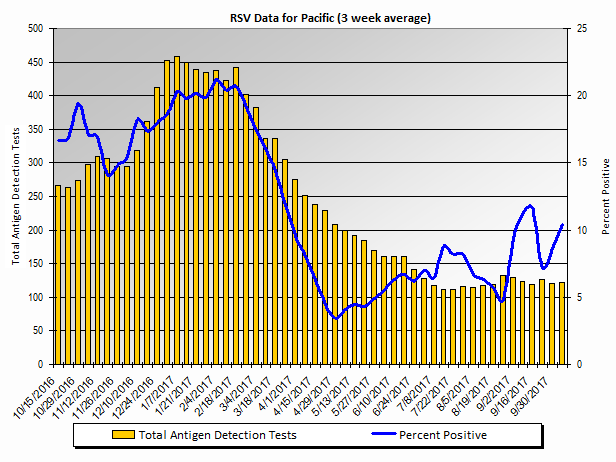
Pacific Census Division
Total Antigen Detection Tests
Total PCR Tests
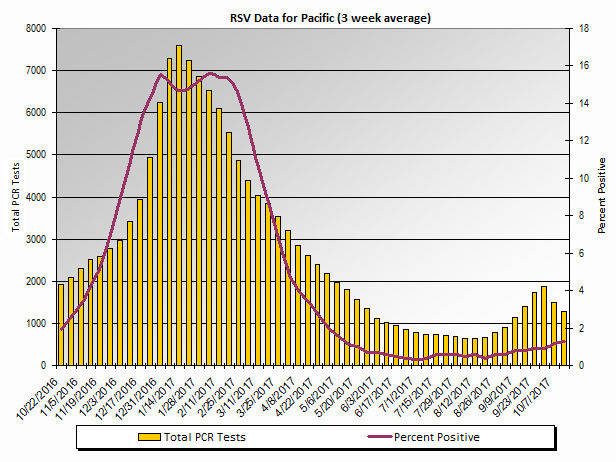
Table: Pacific Census Division percent positive RSV PCR tests, by 3 week moving average
- Page last reviewed: February 27, 2017
- Page last updated: February 27, 2017
- Content source: