Plotting and Interpreting BMI-for-age by Using the Metric System
A Case Study of 'Sam'
Step 1. Obtain accurate weights and height measurements
Date of Birth (DOB): 9/15/94
Date of Visit (DOV): 4/4/98
Weight = 16.9 kg
Height = 105.4 cm
Step 2. Select the appropriate growth chart
Because Sam is a normal 3.5-year-old, a standing height was obtained. The appropriate chart to use is the Boys 2 to 20 BMI-for-Age chart.
Step 3. Record the data
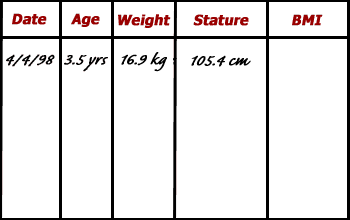
On the data entry table found on the clinical growth chart, information relevant to the growth chart is recorded. Here data has been recorded for the date of visit, the child's age, weight, and height at the visit.

Step 4. Calculate BMI
Calculate BMI at the time of the clinic visit.
Calculations:
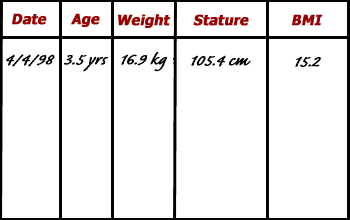
BMI: (16.9 kg / 105.4 cm / 105.4 cm) x 10,000 = 15.2
Then, the BMI of 15.2 is entered on the data entry table.

Step 5. Plot measurements
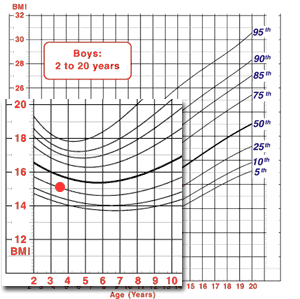
All the necessary information is recorded, and Sam’s BMI can be plotted. On the BMI-for-age chart, find Sam’s age on the horizontal axis, and visually draw a vertical line up from that point. Then, find his BMI on the vertical axis, and visually draw a horizontal line across from that point. The point where the two intersect represents Sam’s BMI-for-age.
When plotted on the growth chart, Sam’s BMI-for-age falls just below the 25th percentile curve.

Step 6. Interpret the plotted measurements
Since Sam’s BMI-for-age falls just below the 25th percentile curve, this means that if 100 children of the same sex and age as Sam from the reference population were assessed, less than 25 children would have a BMI-for-age lower than his, and more than 75 children would have a BMI-for-age higher than his. Sam is not obese, overweight, or underweight.
When a child’s plotted measurement falls between the 5th and 85th percentiles, it is considered to be a healthy weight. Sam’s BMI-for-age is a healthy weight based on this measurement.
- Page last reviewed: May 9, 2014
- Page last updated: May 9, 2014
- Content source:


 ShareCompartir